Nine13 Logistics: Translating Complex Engineering into Human-Centered Decision Support
Translating a Purdue University mathematical simulation into a scenario-based planning dashboard so a nonprofit food distribution network can make data-driven growth decisions without sacrificing the white-glove human care that defines them.
Role
Lead Researcher & Designer
Collaborators
Purdue Eng Team & IU HCI
Clients & Stakeholders
Tom Hanley (CEO), Ashley Acuff (COO)
Impact Domain
Marion County Hunger Relief
Food delivery, built on community trust
Nine13 Logistics started as a youth cycling nonprofit and pivoted during COVID-19 to meet an urgent civic need: getting nutritious food to people who couldn't safely leave their homes. Today they partner with Gleaners Food Bank, Midwest Food Bank, and the Indy Hunger Network to serve Marion County residents facing food insecurity, operating a fleet of three vans and two box trucks that at peak reaches over 1,000 residents per week.
They run two distinct operations: box truck deliveries that pick up bulk pallets from food banks and distribute them to community pantries, and CICOA-funded van routes that deliver directly to seniors and individuals with limited mobility. What sets Nine13 apart is their white-glove standard: drivers don't drop boxes on porches. They carry food inside, wait patiently, and know clients by name.
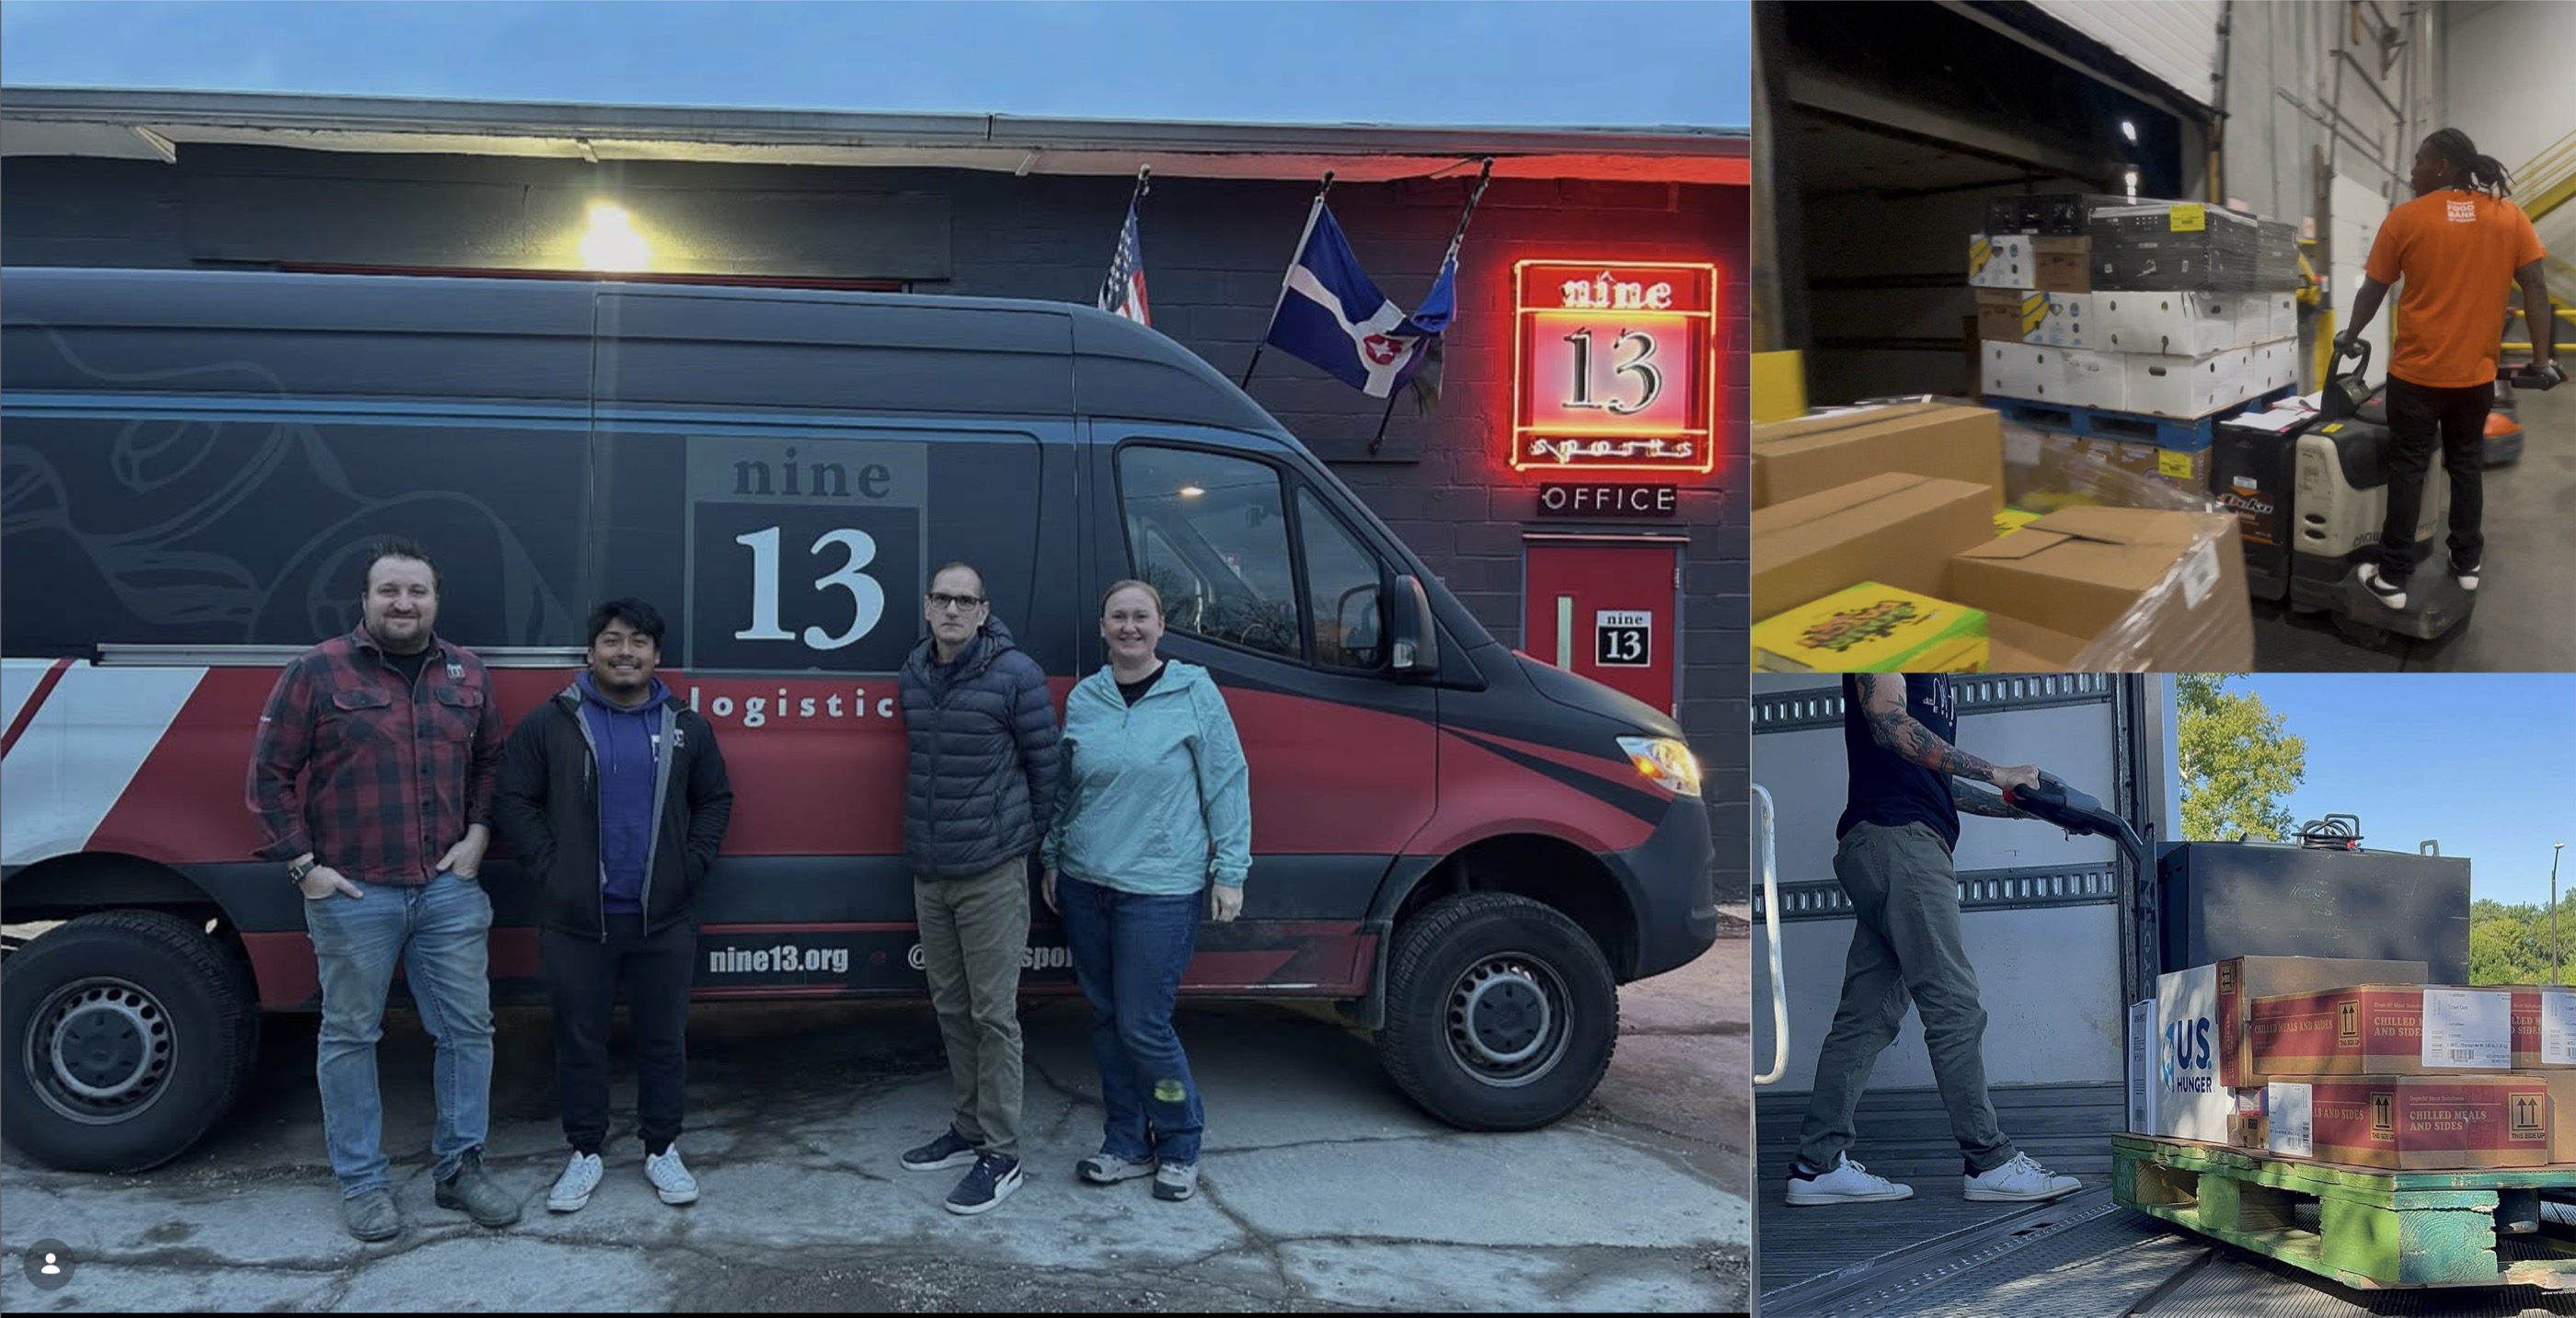
Figure 1: Nine13 Logistics fleet operations, warehouse staging, and driver logistics on site.
The model existed. The interface didn't.
Nine13 was growing rapidly without a way to model what that growth would actually cost. Every scheduling decision ran through one person's inbox and memory. Their routing software produced clean digital plans that had no understanding of a broken call box at 8am, a locked apartment building, or a client who needed five minutes just to reach the door.
"Some stops take 15 seconds, some take 10 minutes, the software just doesn't know that."
Purdue University's engineering team built a sophisticated mathematical model capable of running thousands of what-if simulations around trucks, drivers, and delivery volume. But it was designed for engineers, with raw code scripts and dense data matrices. There was no user interface, no plain language, and no way for Tom or Ashley to simply ask: "What actually happens if we add one more truck or take on 10 new pantry contracts?"
Our Core Mission
Bridge the gap between Purdue's algorithmic horsepower and Nine13's daily human realities: design an interface layer that translates the model's simulation power into a tool Tom could use before a board meeting and Ashley could rely on before a dispatch morning.
We went where the work actually happened
Before designing screens, we reviewed Purdue's model outputs. The graphs were dense and difficult to interpret, the clearest signal that an interface translation layer wasn't optional. We engaged in deep qualitative fieldwork across two primary tracks:
Stakeholder Interviews
Semi-structured sessions with Tom (CEO) and Ashley (COO). Qualitative transcript coding to surface hidden pain points, cognitive shortcuts, and latent operational needs.
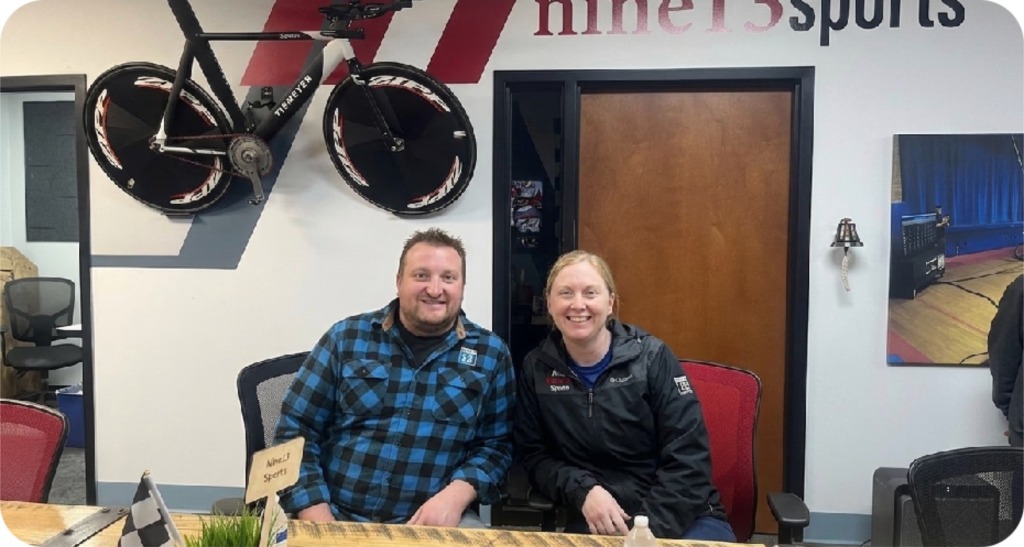
Figure 2: Stakeholder interview sessions with Tom Hanley (CEO) and Ashley Acuff (COO) at Nine13 headquarters.
Field Shadowing & Ride-Alongs
Ride-alongs with drivers on bulk pallet box truck runs and direct van home delivery routes. Direct observation of real failure cases: not described in meetings, but witnessed in real time.
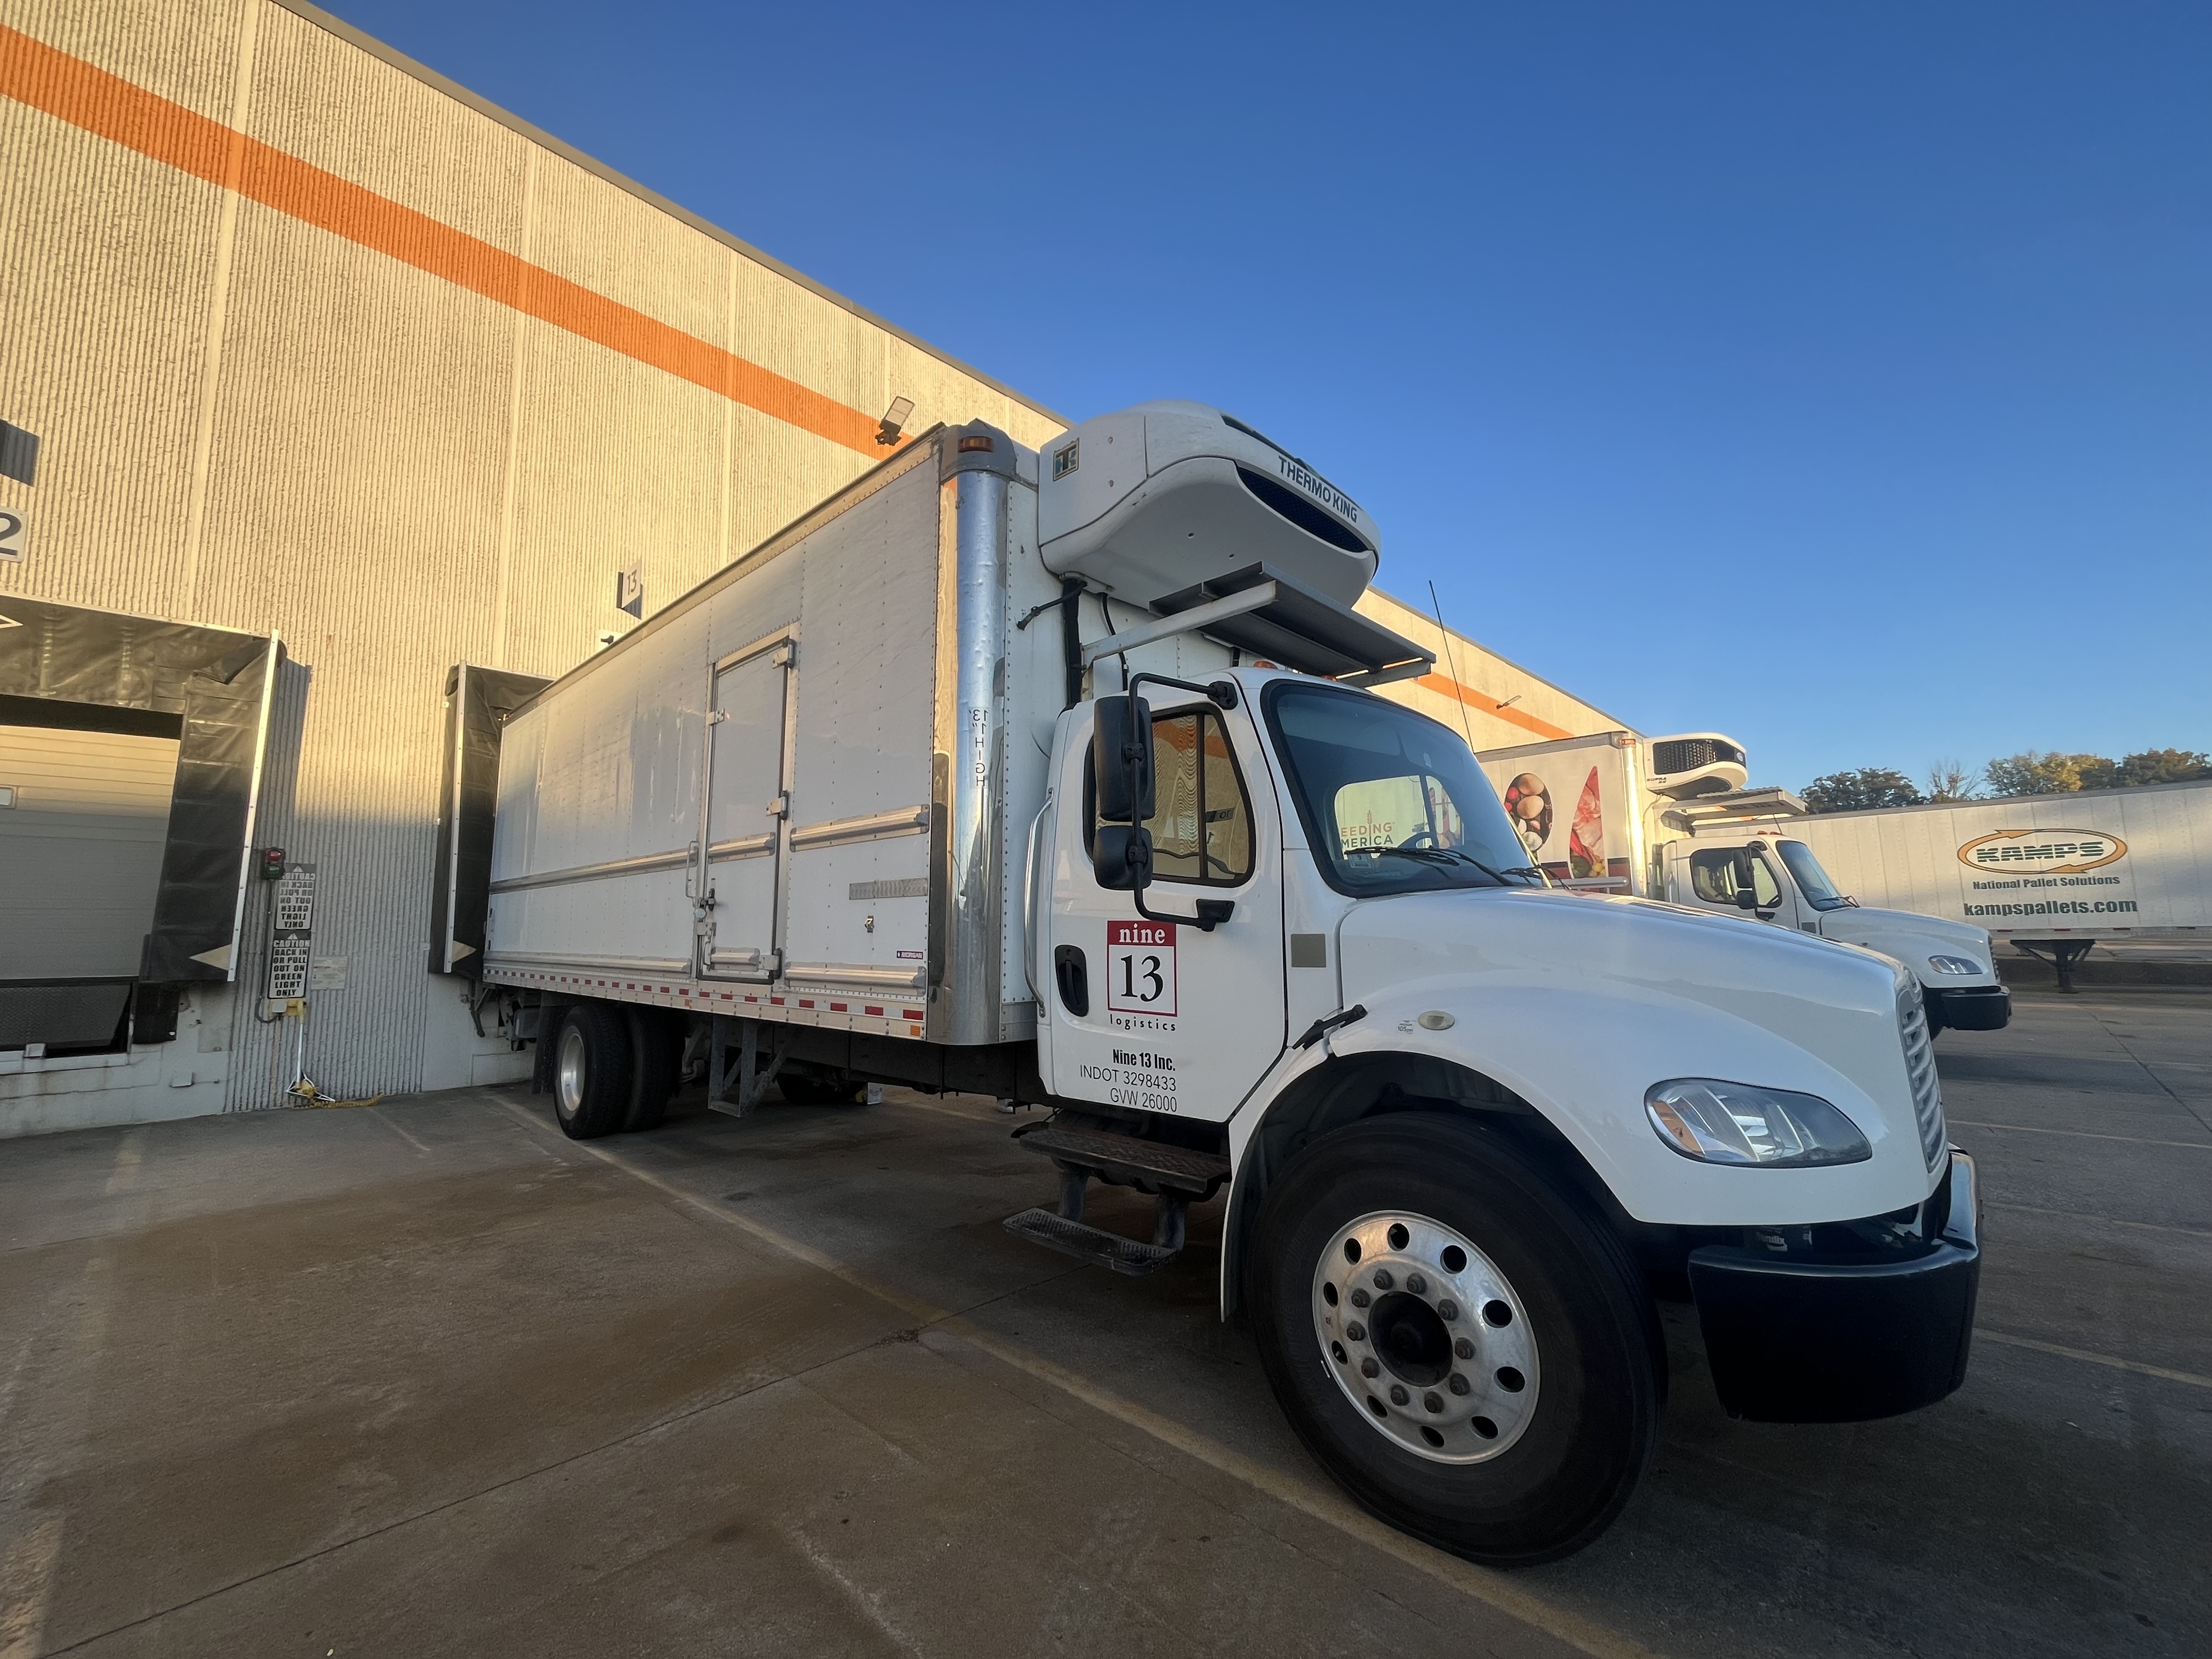
Figure 3: On-the-ground driver ride-along observation documenting real delivery dwell times and access friction.
Key Findings That Shaped the Architecture
No Record, No Basis for Strategic Decisions
Tom couldn't predict the impact of adding trucks or contracts because data lived across scattered tools and memory. When a delivery hit an exception, it was noted on paper and vanished by end of day.
Routing Software Was Optimistic by Design
Standard route algorithms assumed seamless door drops. They had zero buffer for locked complexes, broken intercoms, or mobility-challenged recipients.
Two Routes, Two Different Realities
Pantry routes focus on bulk pallet loading and fixed schedules, while home deliveries require door-to-door interaction, timing flexibility, and human empathy.
Same organization, two distinct entry points

Tom Hanley
THE STRATEGIC THINKER · CEO
High-level growth, board oversight & funder trust
- • Scenario comparisons across quarterly budgets
- • Clear impact forecasts for grant proposals
- • Executive confidence backed by empirical data
Ashley Acuff
THE LOGISTICS BACKBONE · COO
Fleet operations, driver shifts & route exceptions
- • Adjust dispatch constraints and route buffers on the fly
- • Historical exception pattern logging
- • Tomorrow's delivery route planning clarity
Two routes. Two completely different task flows.
When we mapped the Hierarchical Task Analysis (HTA) for both delivery paradigms, we uncovered two fundamentally different operational realities. Click on either diagram below to zoom and inspect every decision node and exception loop in full resolution.
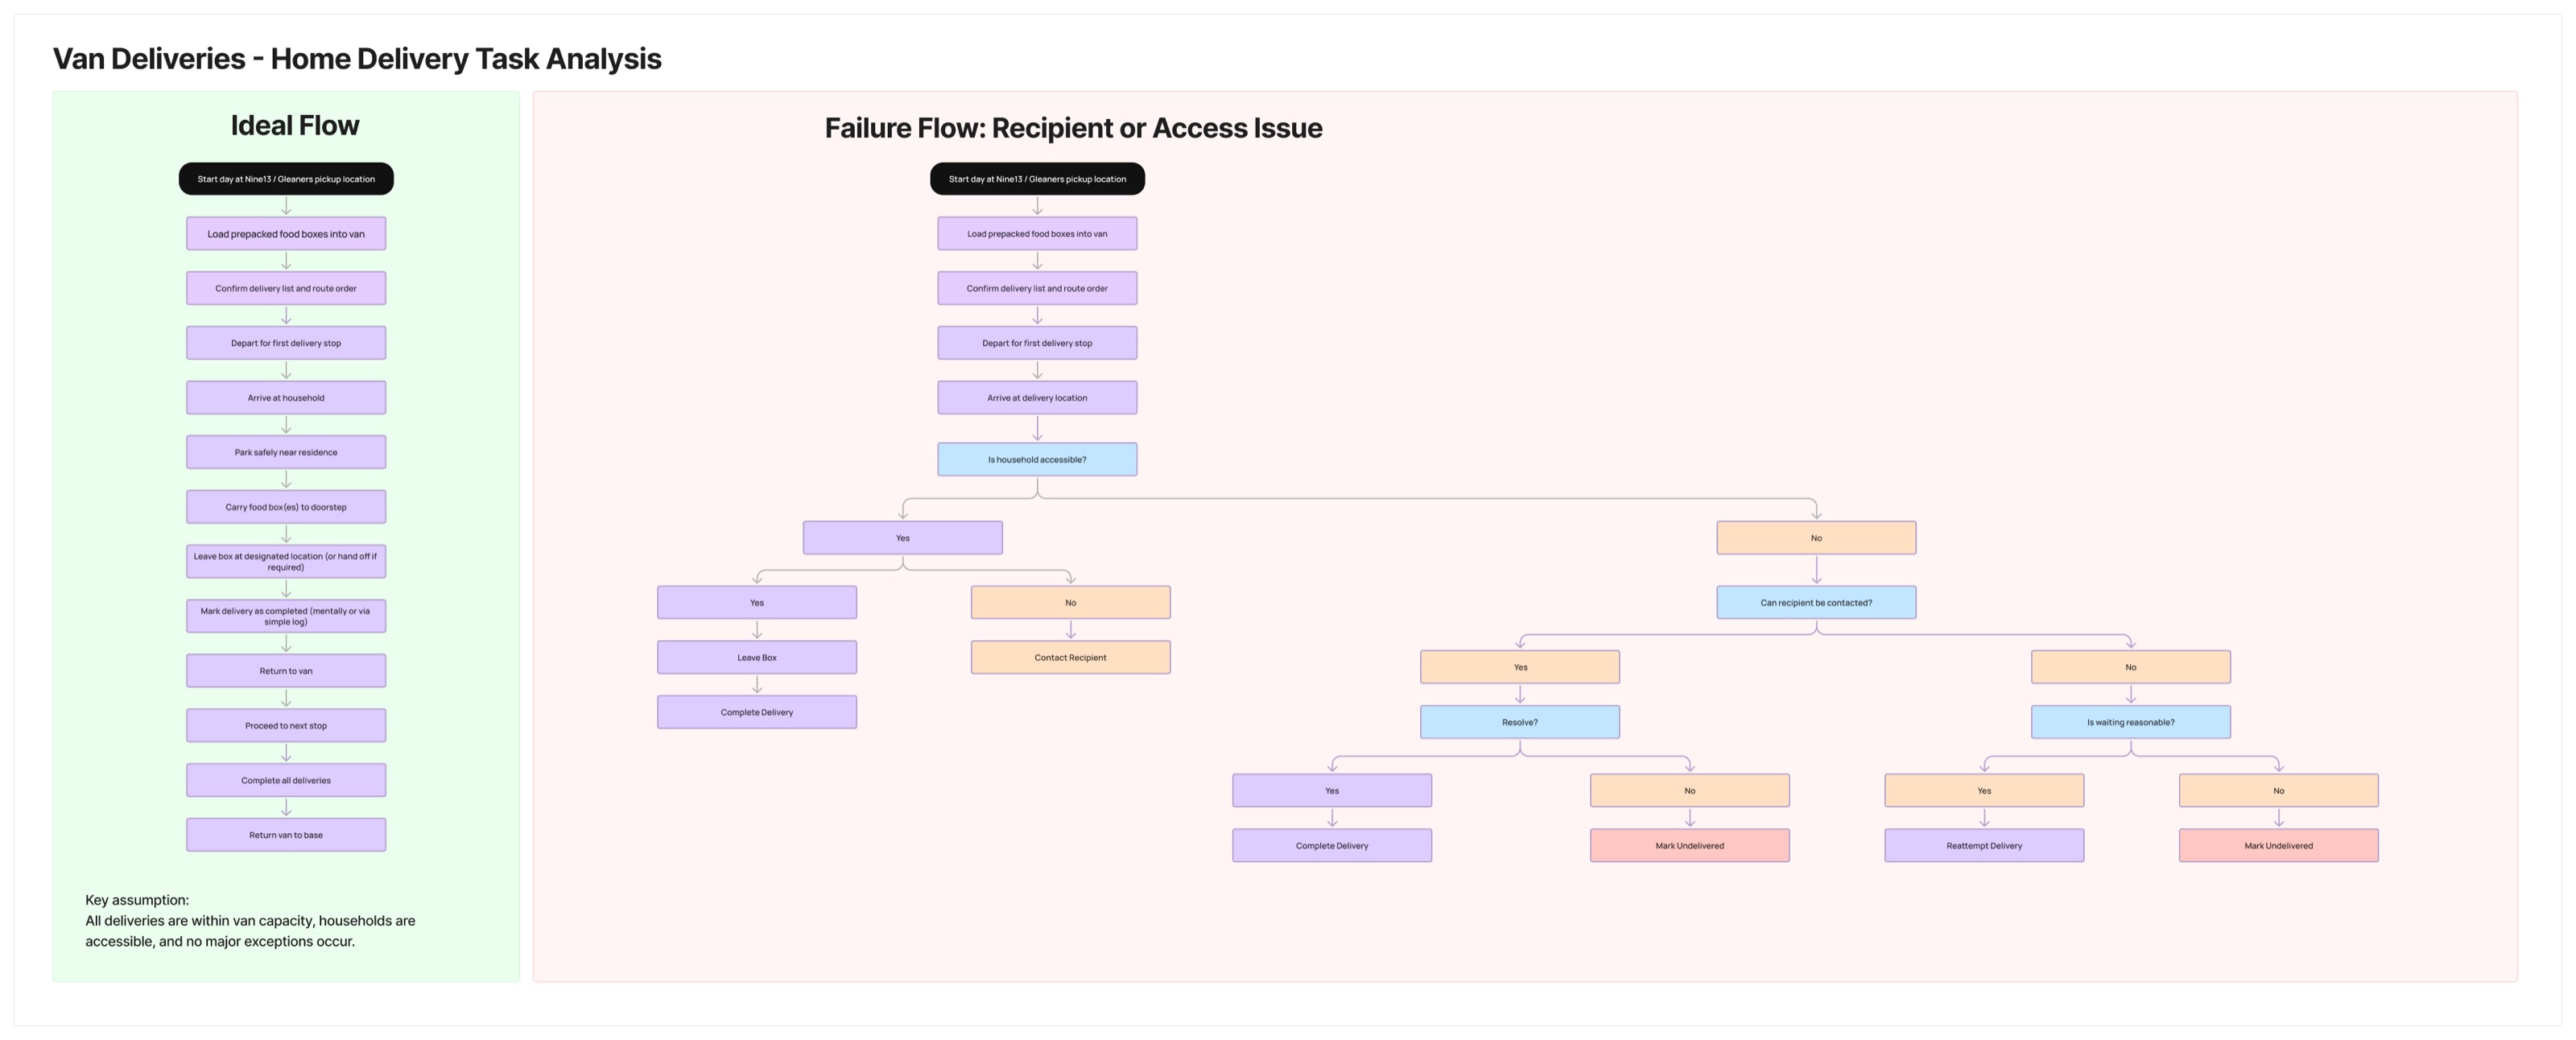
Figure 4: CICOA Van Home Deliveries HTA: Variable dwell times and door-to-door human care
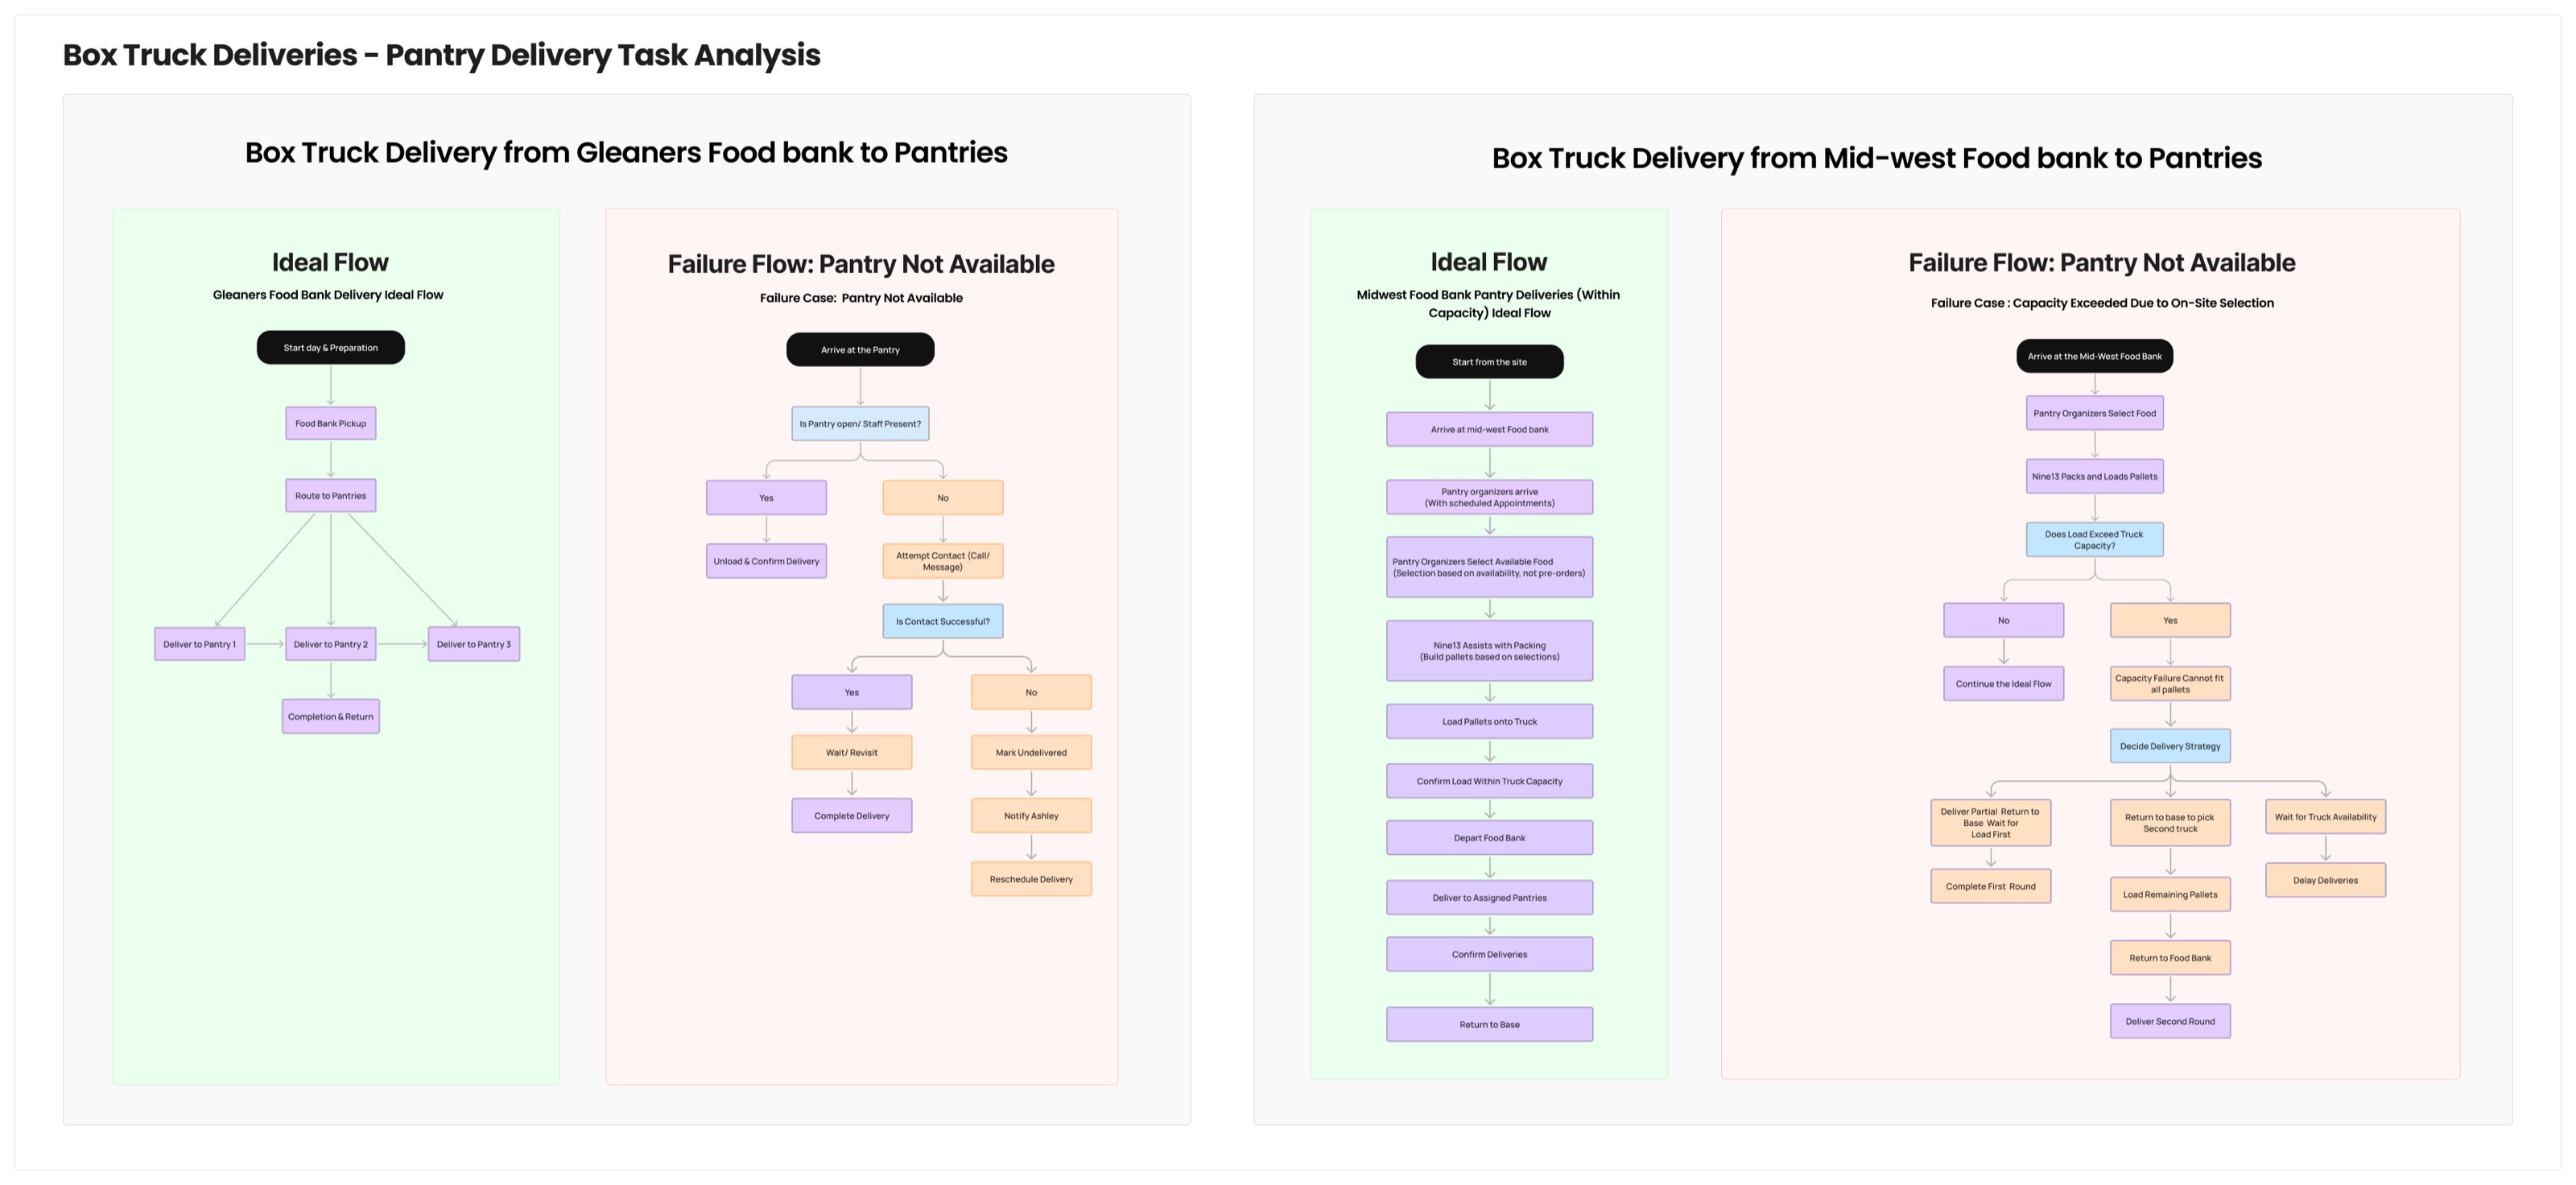
Figure 5: Box Truck Pantry Routes HTA: Bulk pallet coordination and fixed delivery windows
Information Architecture: The Baseline as Anchor
To ensure users never feel lost in abstract mathematical simulation variables, we grounded every exploration in a known anchor: the Baseline Scenario. Users can adjust parameters (number of trucks, driver shifts, stop limits), immediately witness real-time delta shifts, and preserve or archive scenarios for board reporting.
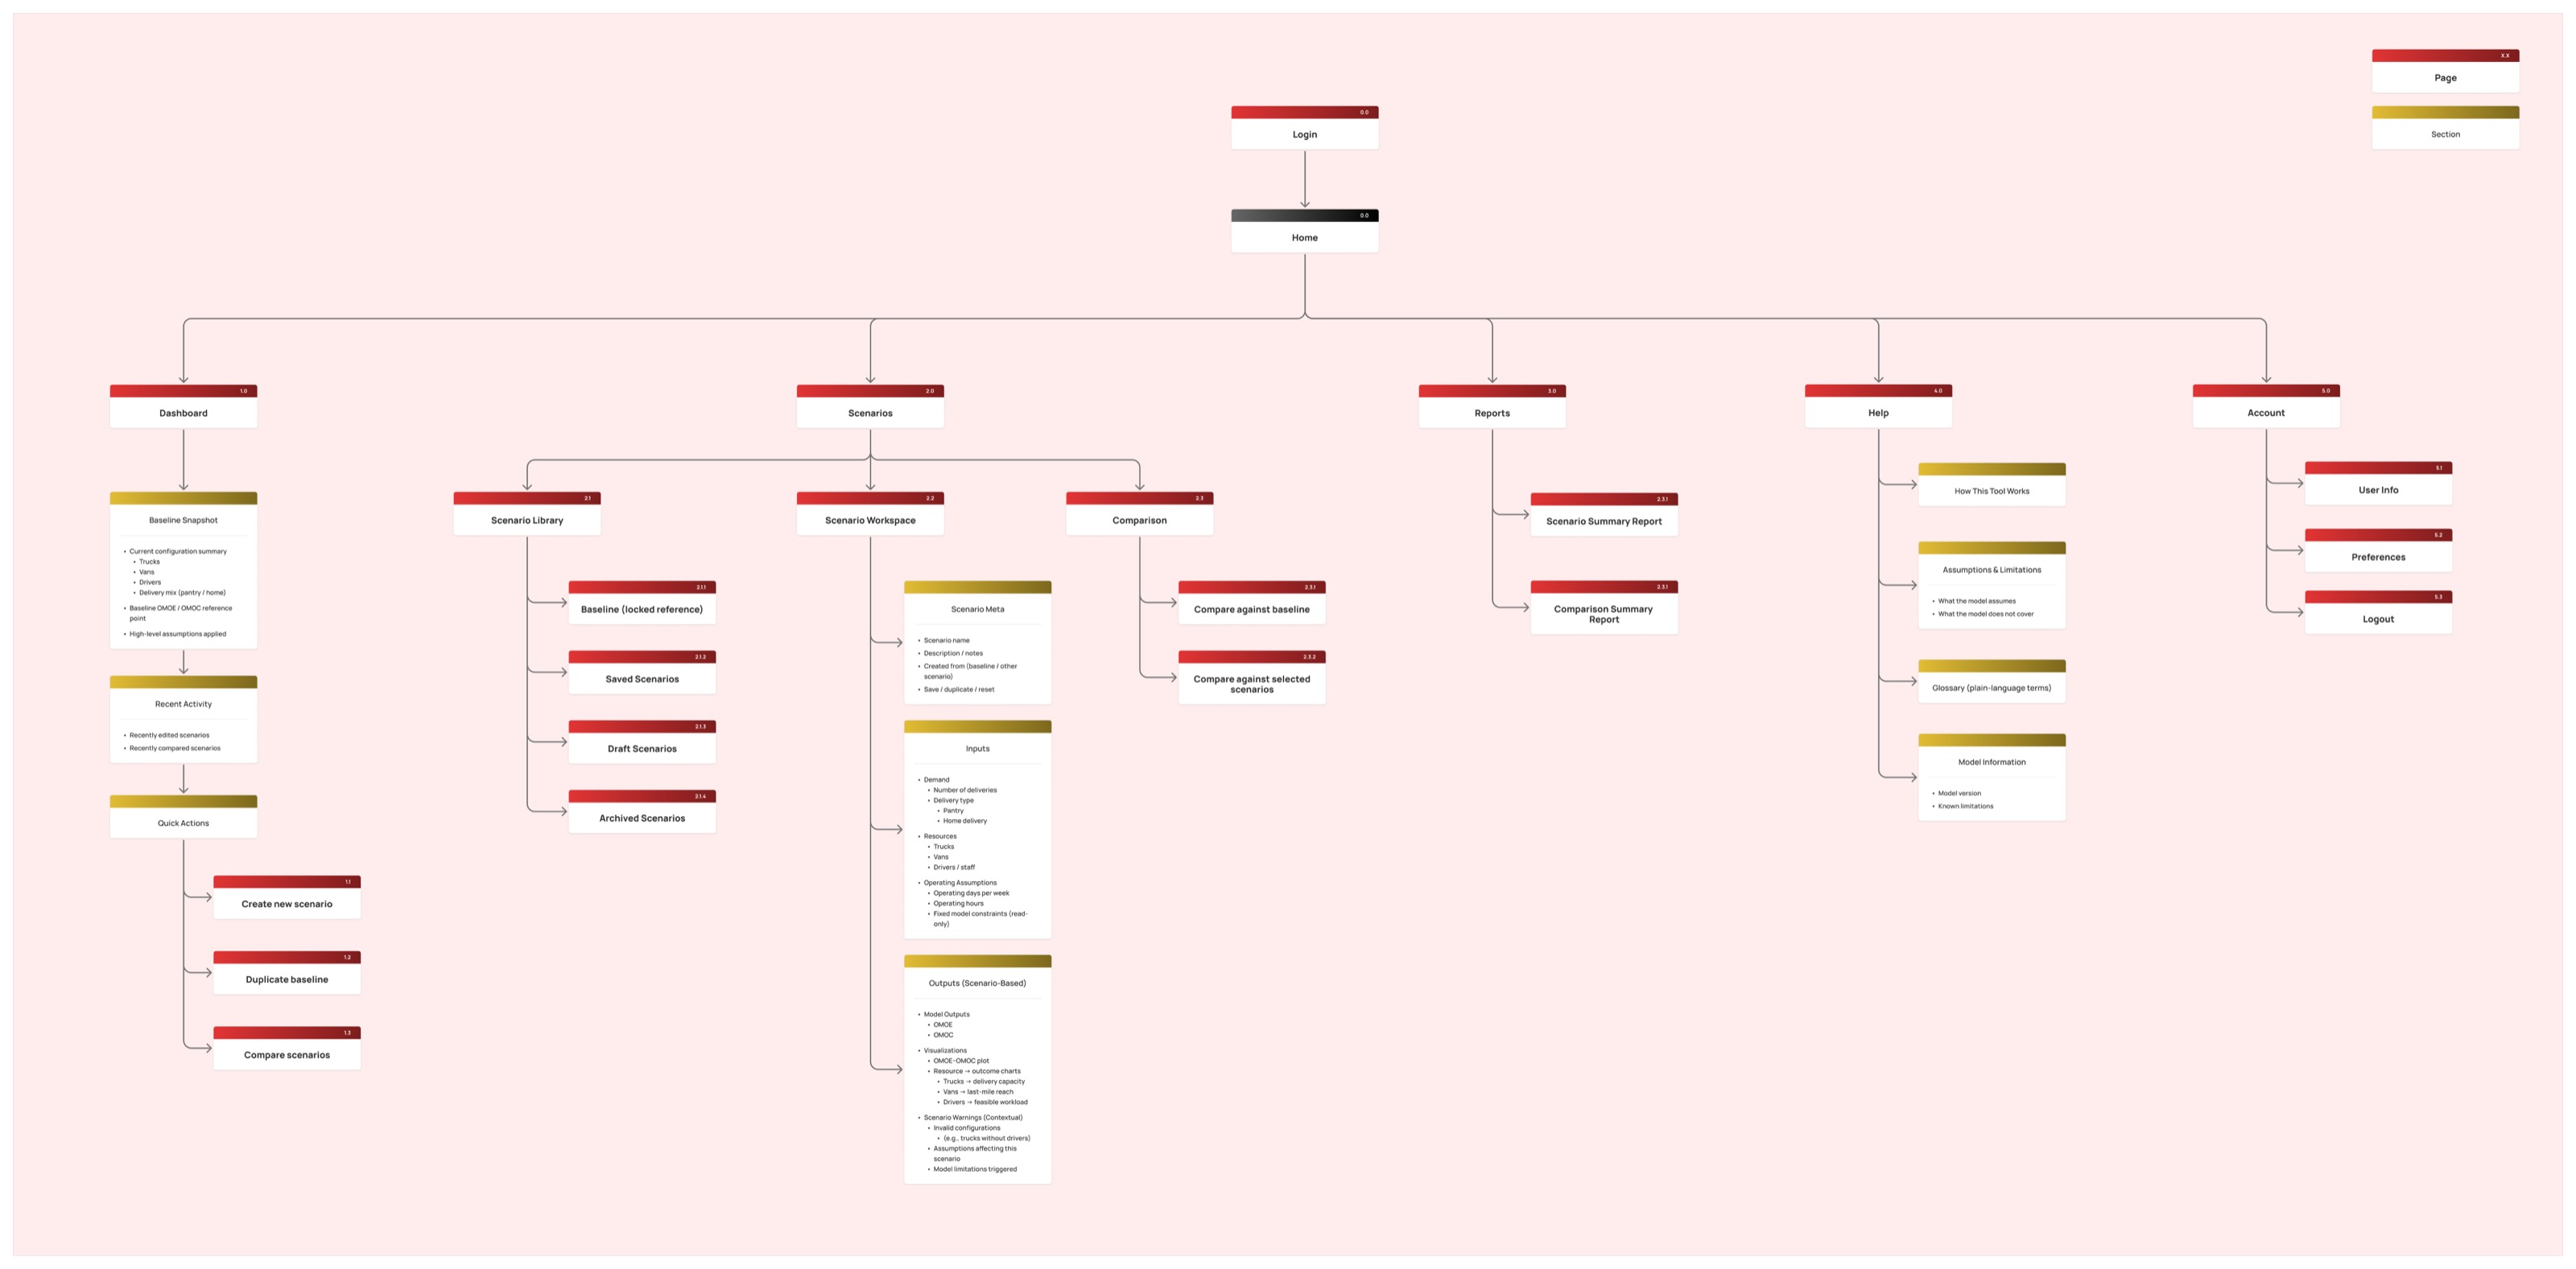
Figure 6: Complete Information Architecture bridging simulation parameters and scenario comparison libraries.
Testing the Mid-Fidelity Prototype
We ran Think Aloud usability sessions with two Nine13 domain experts, Ashley (COO) and Peter Lacey (CSO), across five core planning tasks.
Difficulty: 1 = least difficult, 5 = most difficult.
| Task | Ashley | Peter | Difficulty (Ashley / Peter) |
|---|---|---|---|
| Create a baseline scenario | Completed | Completed | 2 / 1 |
| Use reverse calculate | Not completed independently | Not completed independently | 4 / 2 |
| Compare scenarios | Completed with minor confusion | Not completed fully | 2 / 3 |
| Preserve the dashboard | Completed | Completed | 4 / 2 |
| Download reports | Completed | Completed quickly | 1 / 1 |
Create a baseline scenario
Diff: 2 / 1Use reverse calculate
Diff: 4 / 2Compare scenarios
Diff: 2 / 3Preserve the dashboard
Diff: 4 / 2Download reports
Diff: 1 / 1Real World Usage
4.5 / 5
Ease of Use
4.0 / 5
Confidence
4.0 / 5
Label Clarity
3.0 / 5
What worked
- • Baseline setup and report downloads were easy
- • Charts were the most valued feature
- • Both experts would use it in their real work
What needed work
- • Reverse Calculate was hard to find
- • Unclear labels like "Solve" and too many buttons per screen
- • Compare wasn't where users expected it
- • The combined "both" delivery option didn't match real operations
These findings shaped the redesigned interface ↓
High-Fidelity Interface & Interactive Features
We vibe-coded the interface directly, translating research decisions into a working product in real time. Each screen below is rendered at original resolution. Click any screen to zoom and inspect individual metrics and controls.
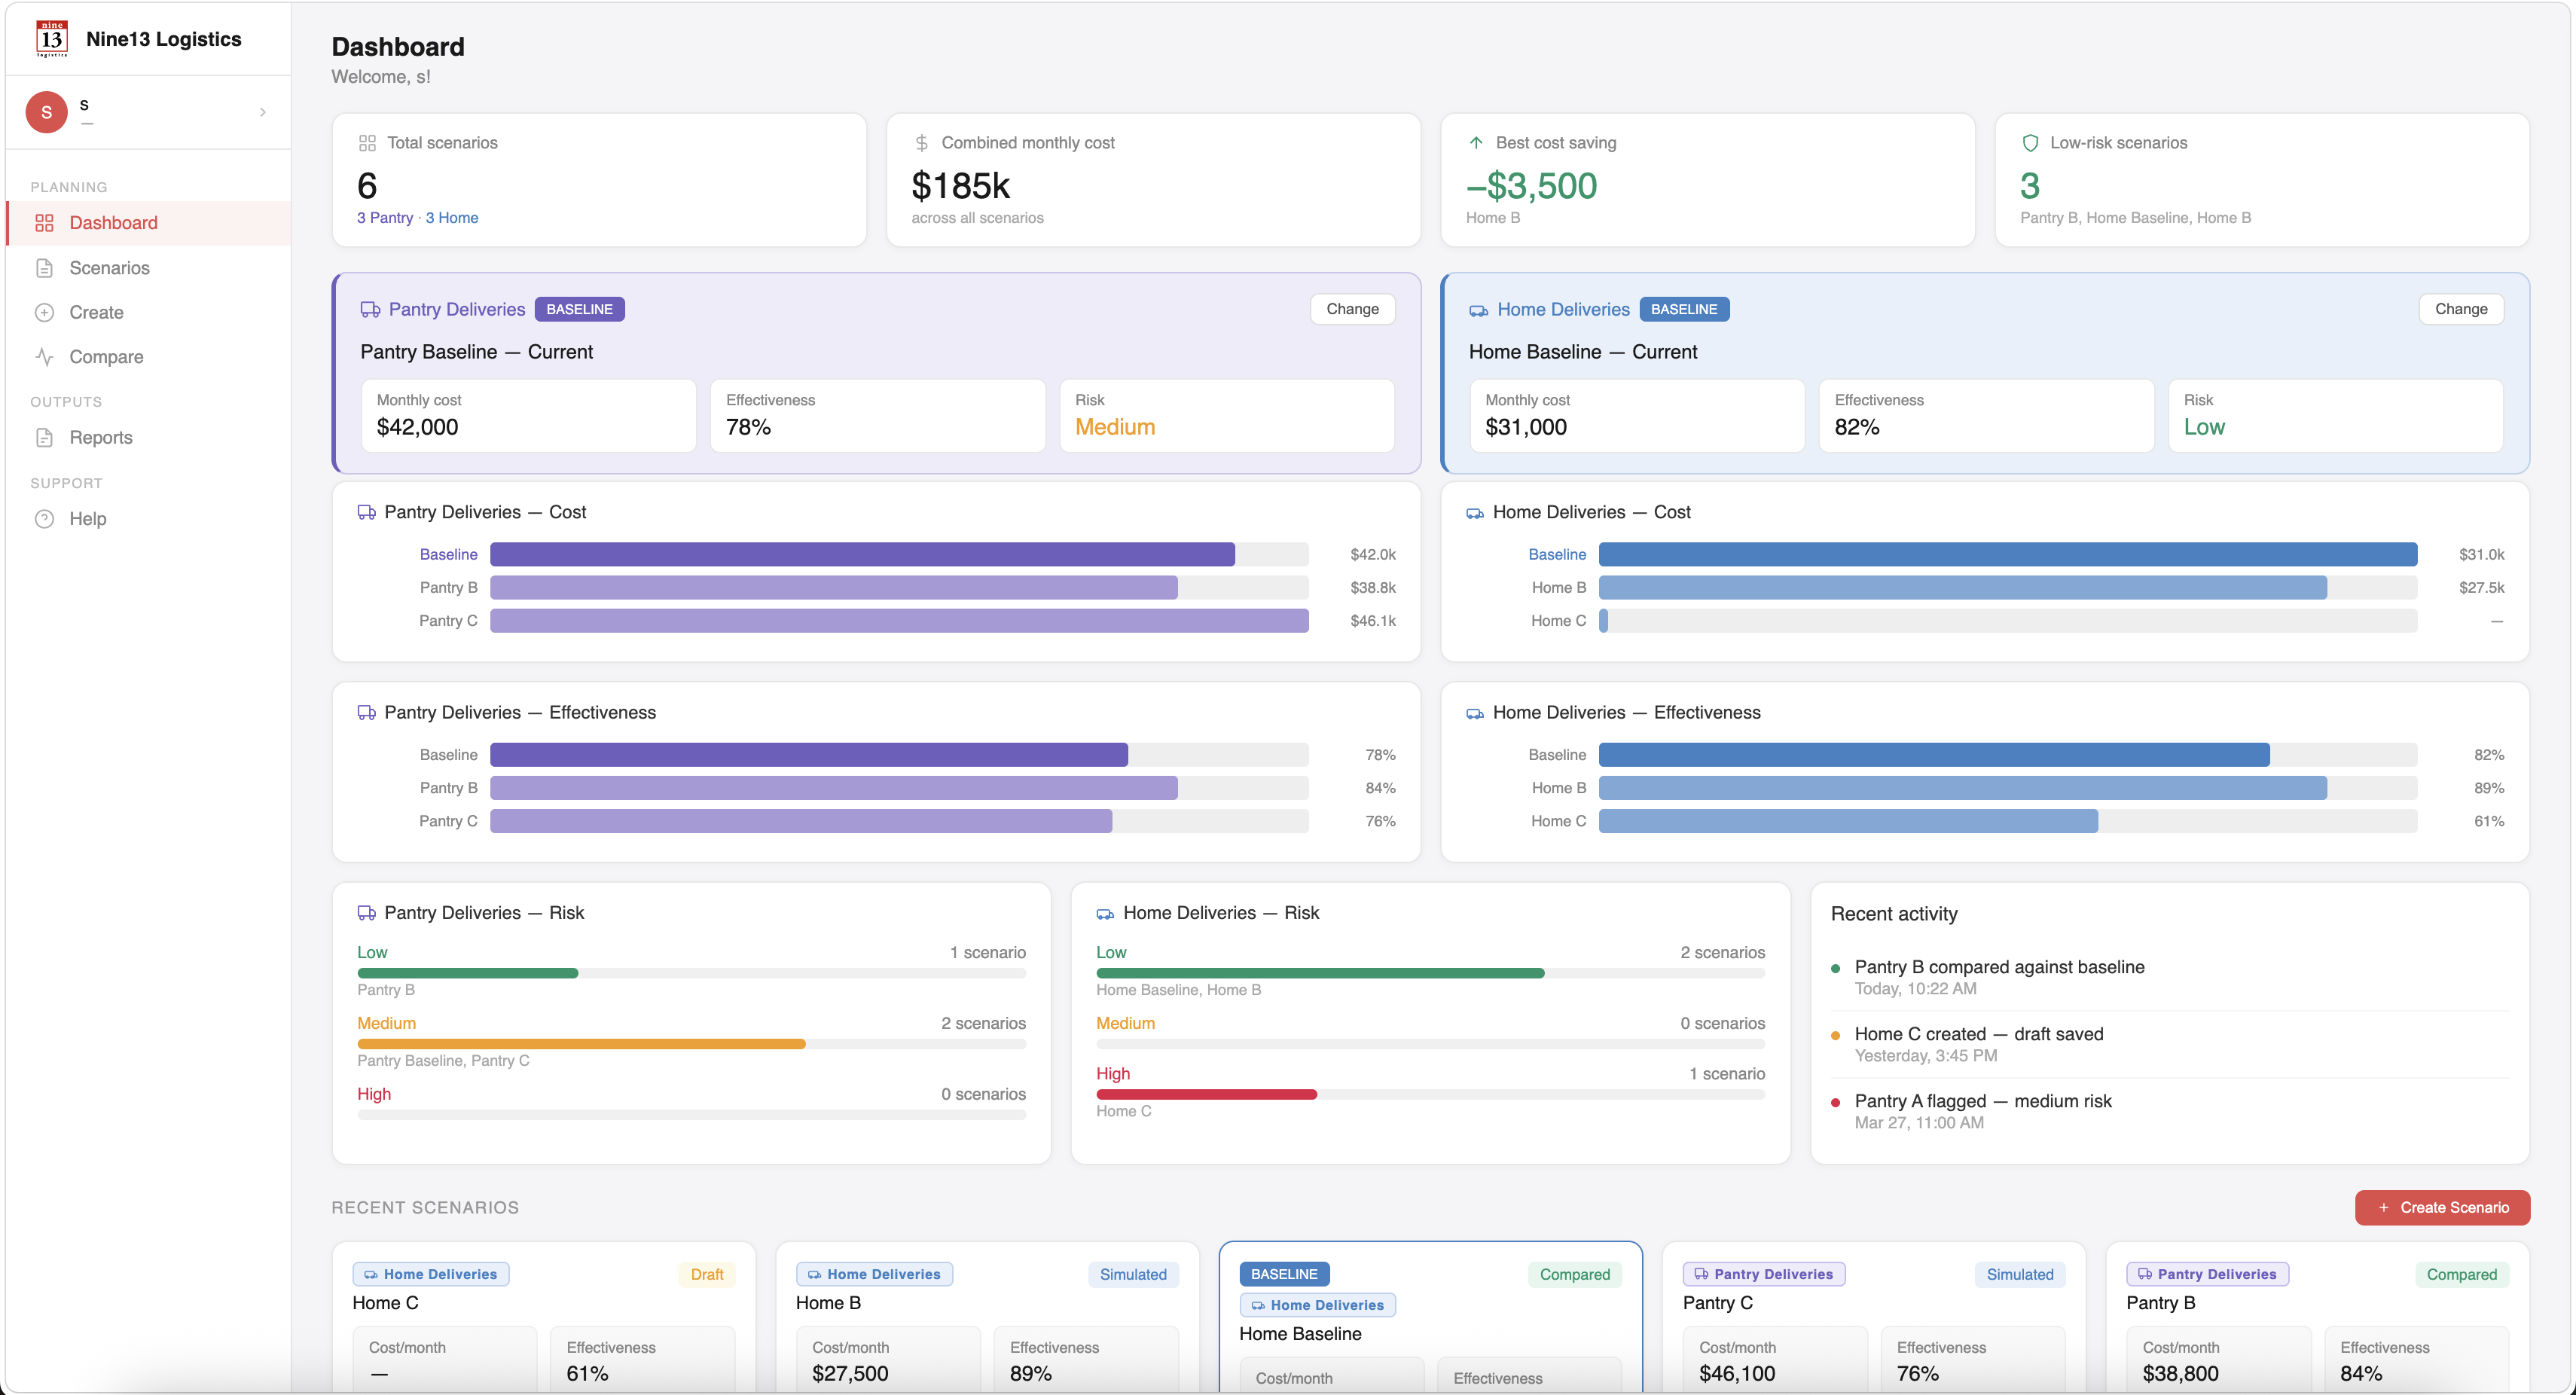
1. Operational & Scenario Dashboard
A real-time overview of every fleet scenario across both delivery lines, Pantry and Home. It shows combined monthly costs, the best cost savings against each baseline, and how many scenarios are low-risk, with side-by-side cost and effectiveness charts for each line and a live activity feed.
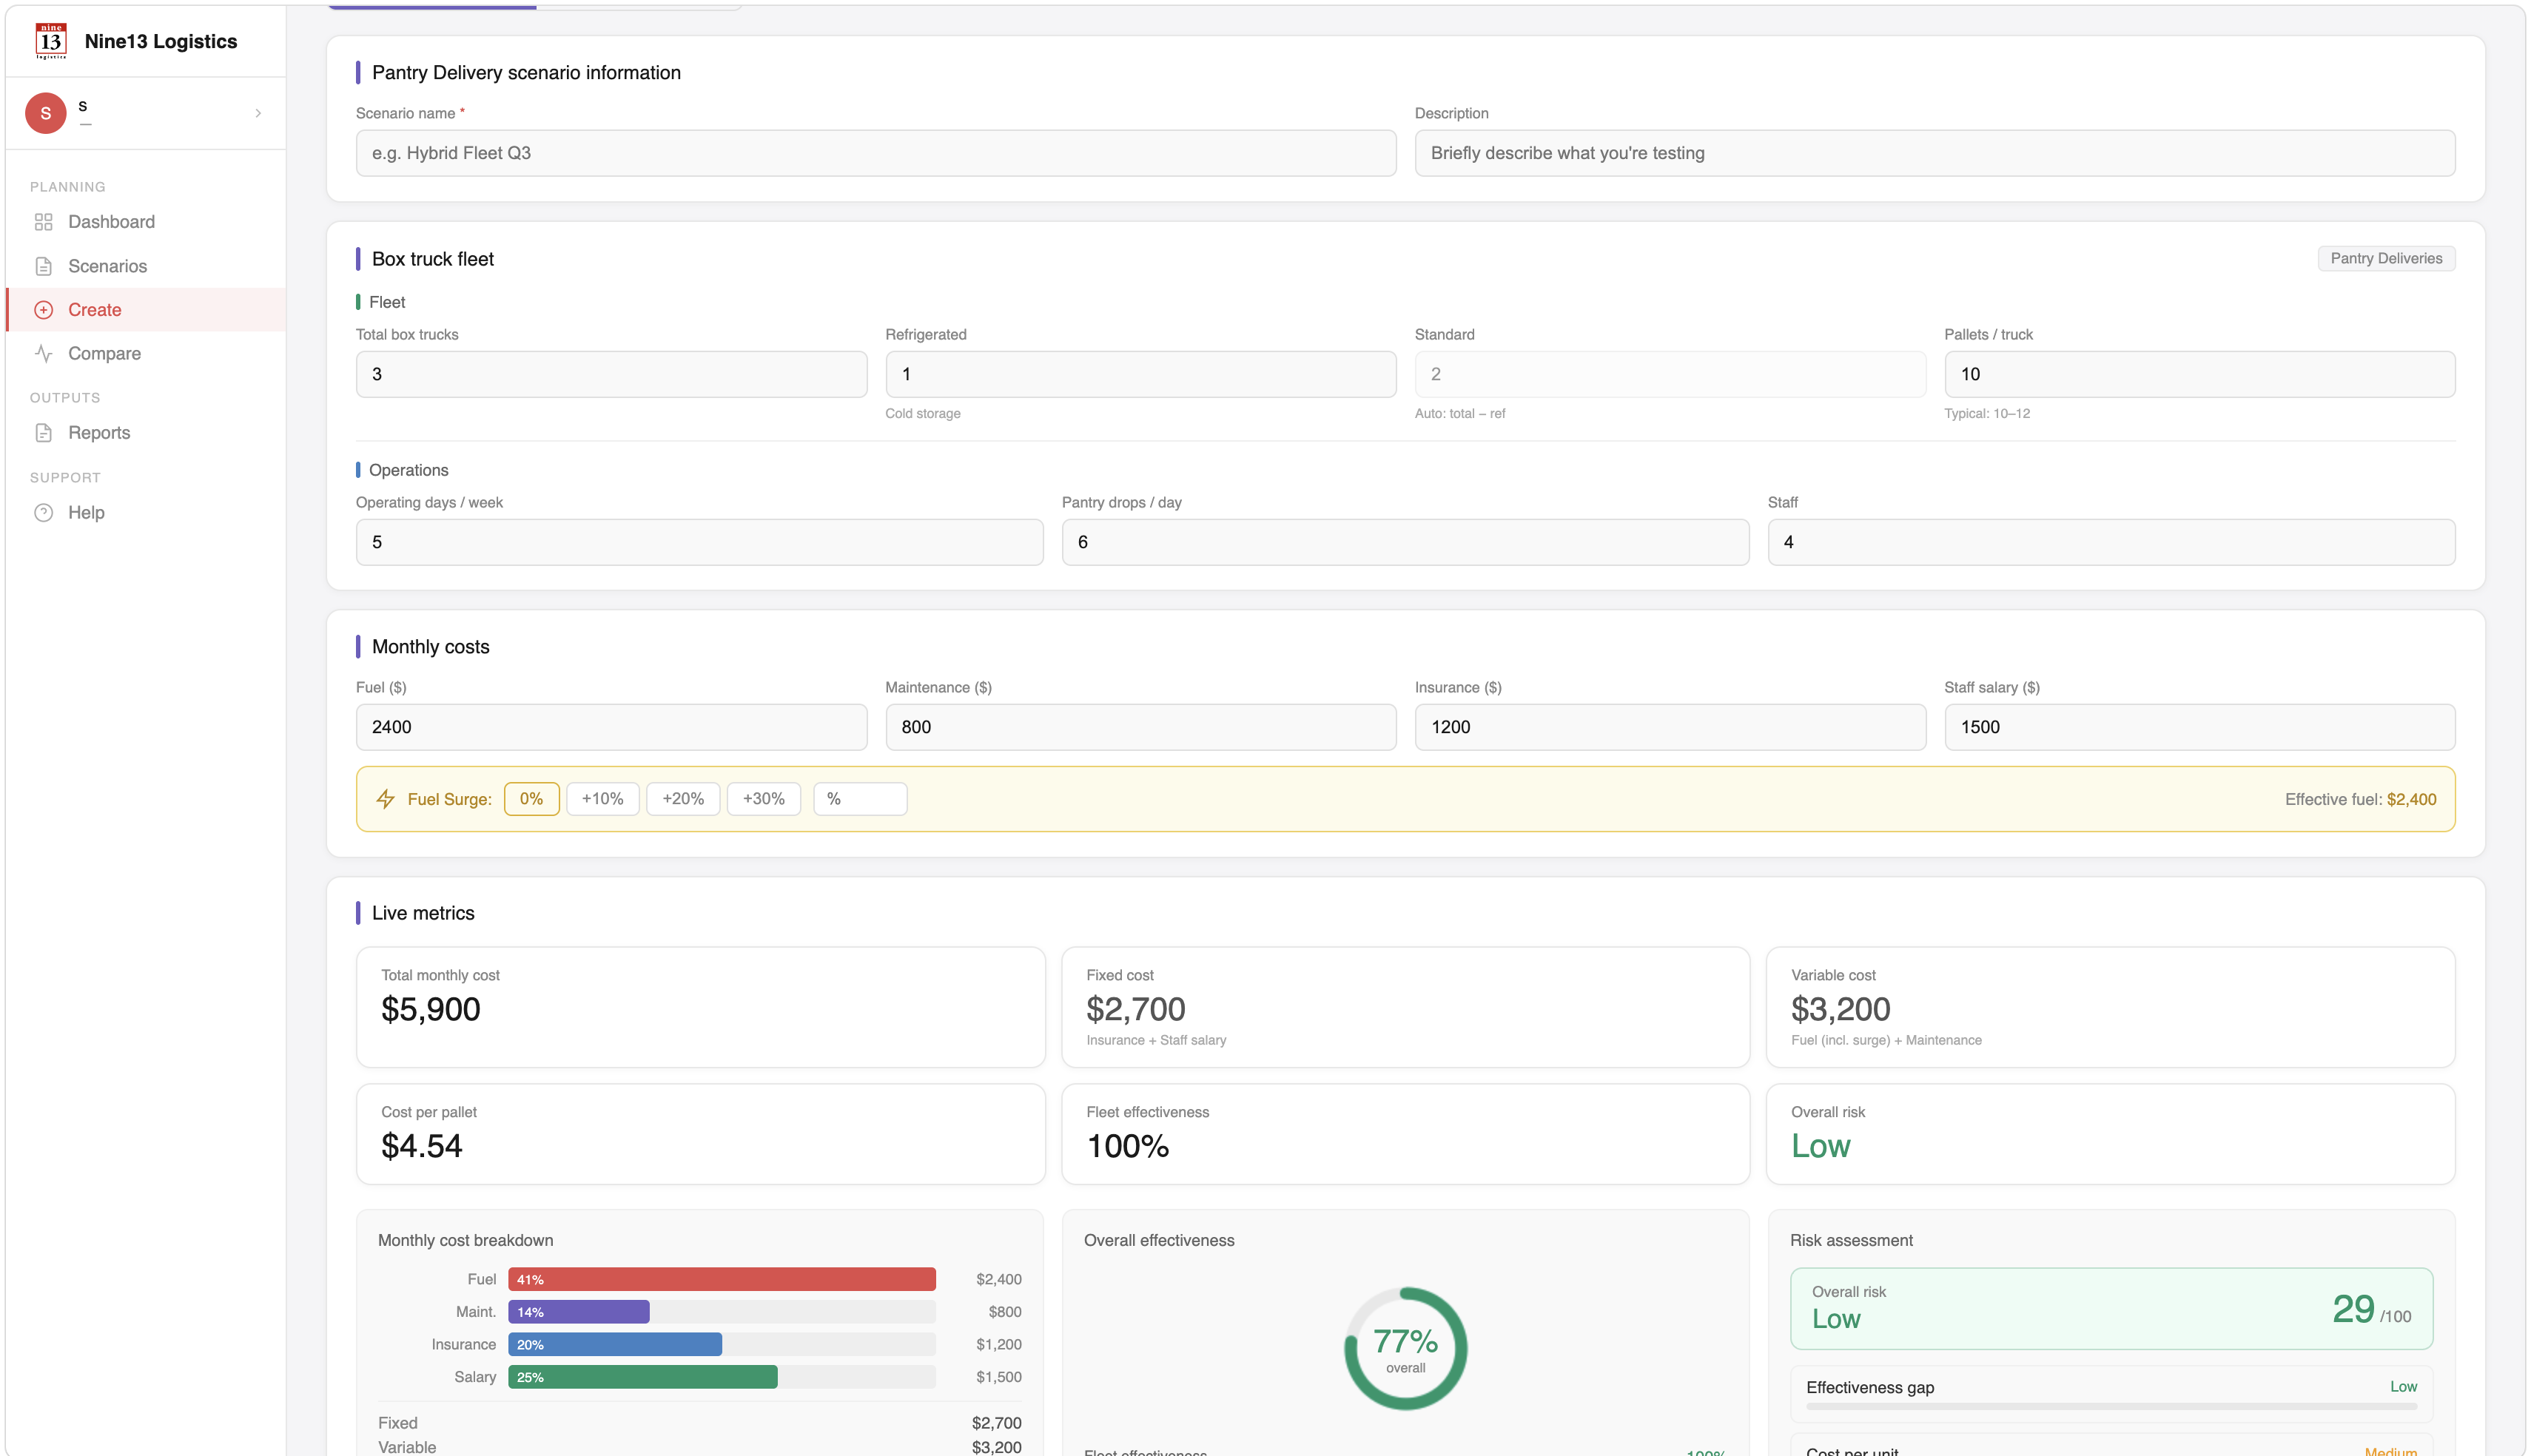
2. Scenario Builder
A forward-planning form where users set fleet size, operating days, delivery volume, and monthly costs for the Pantry or Home line. Metrics update live as inputs change, including total cost, cost per pallet or meal kit, fleet effectiveness, and overall risk score.
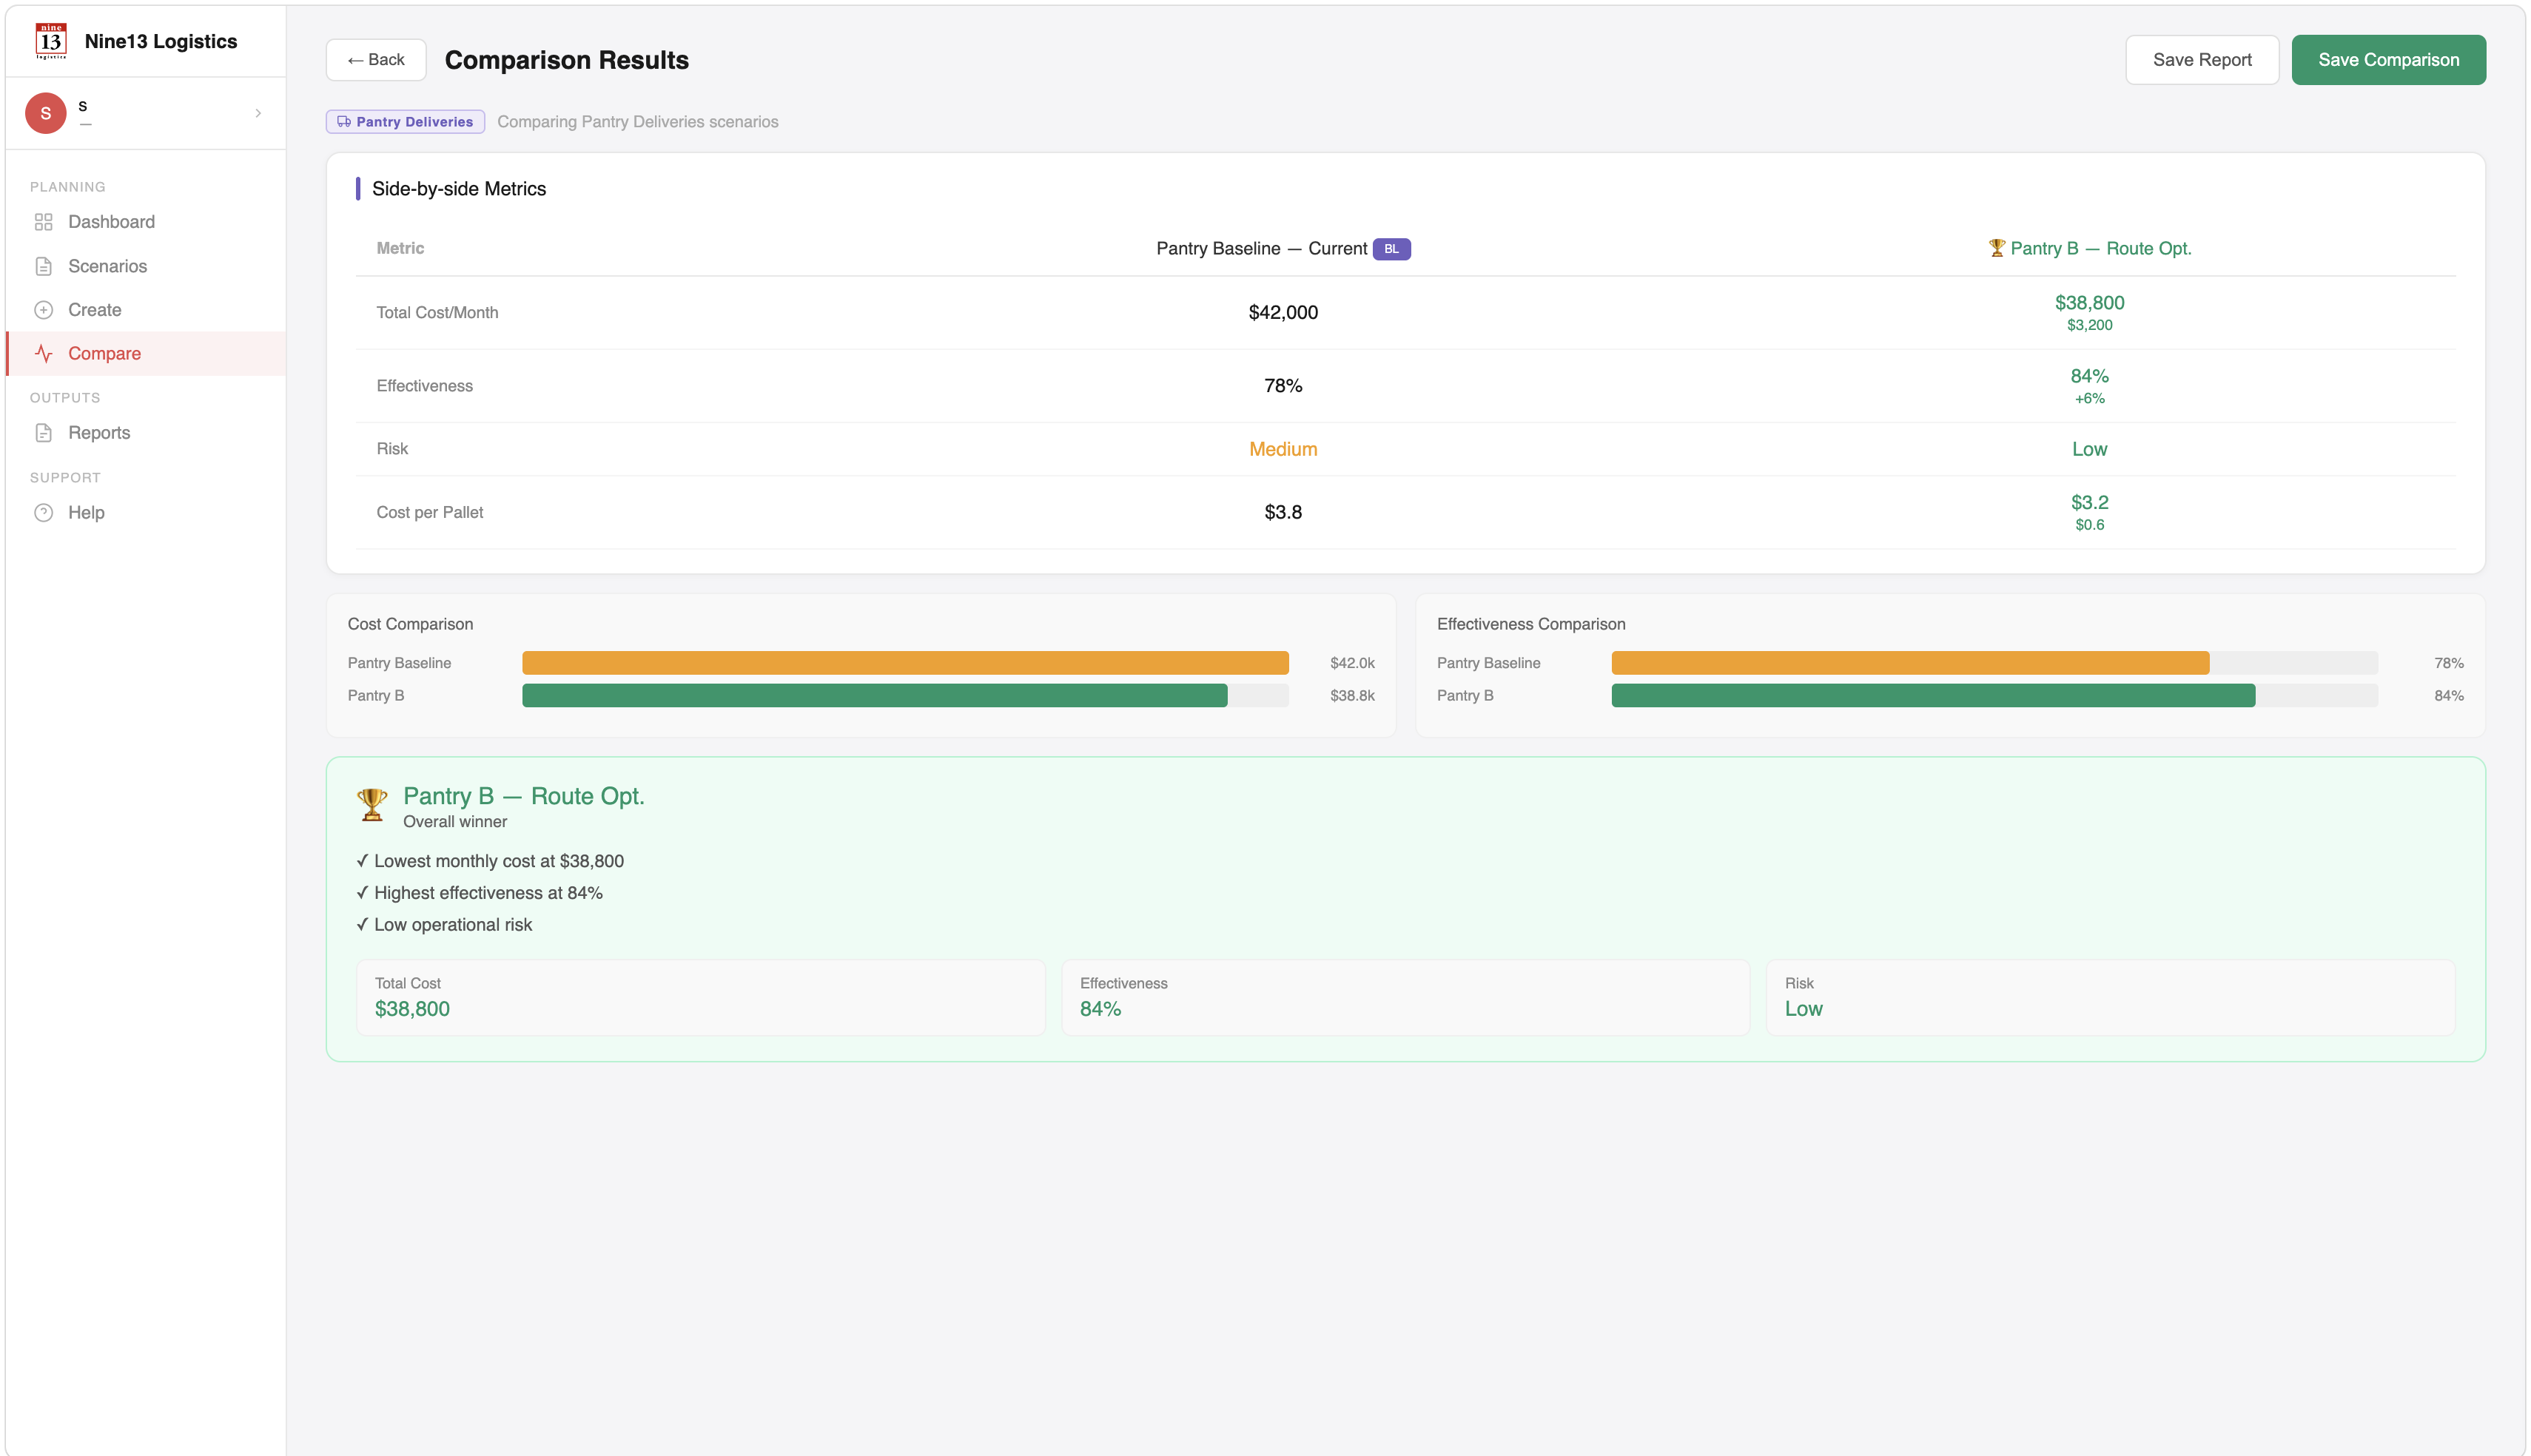
3. Scenario Comparison Matrix
Compares scenarios within the same delivery line side by side, showing cost variance, effectiveness differences, and risk ratings. A weighted scoring model automatically highlights the overall winner.
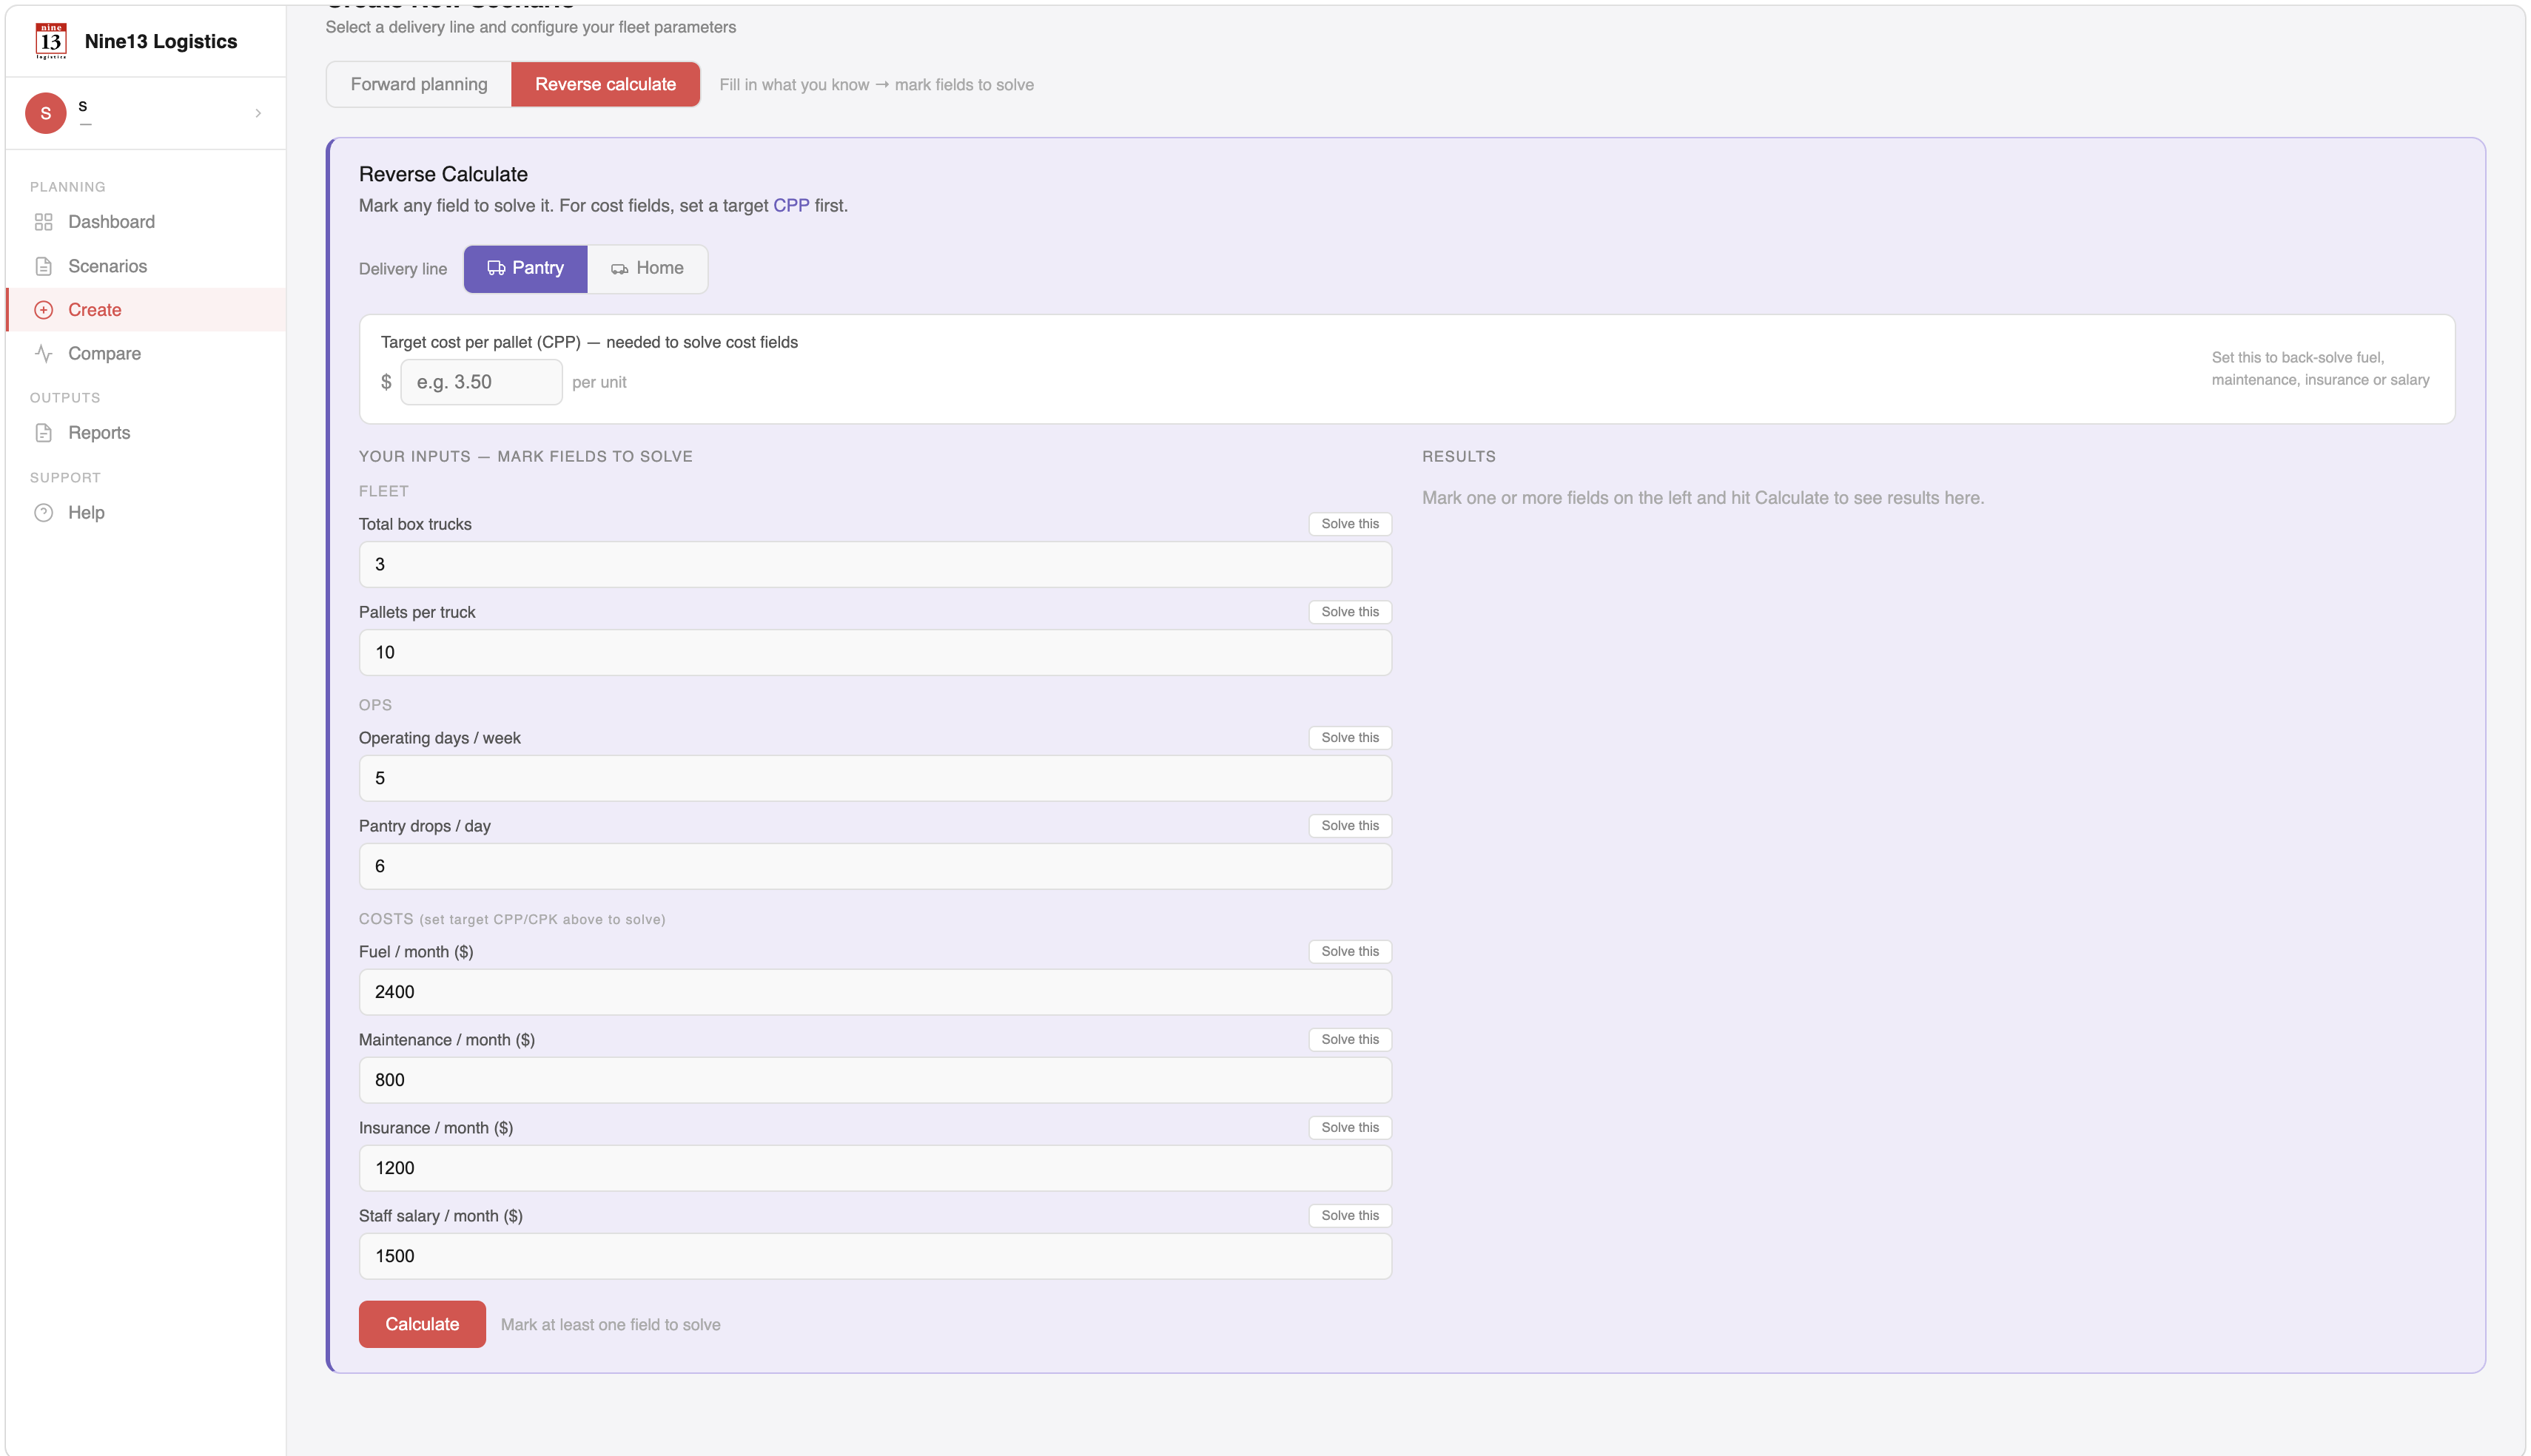
4. Reverse Calculate Feature
Works backward from a delivery target. Users mark which fleet or operations field to solve for, enter what they already know, and the model calculates the missing values needed to hit the required delivery volume.
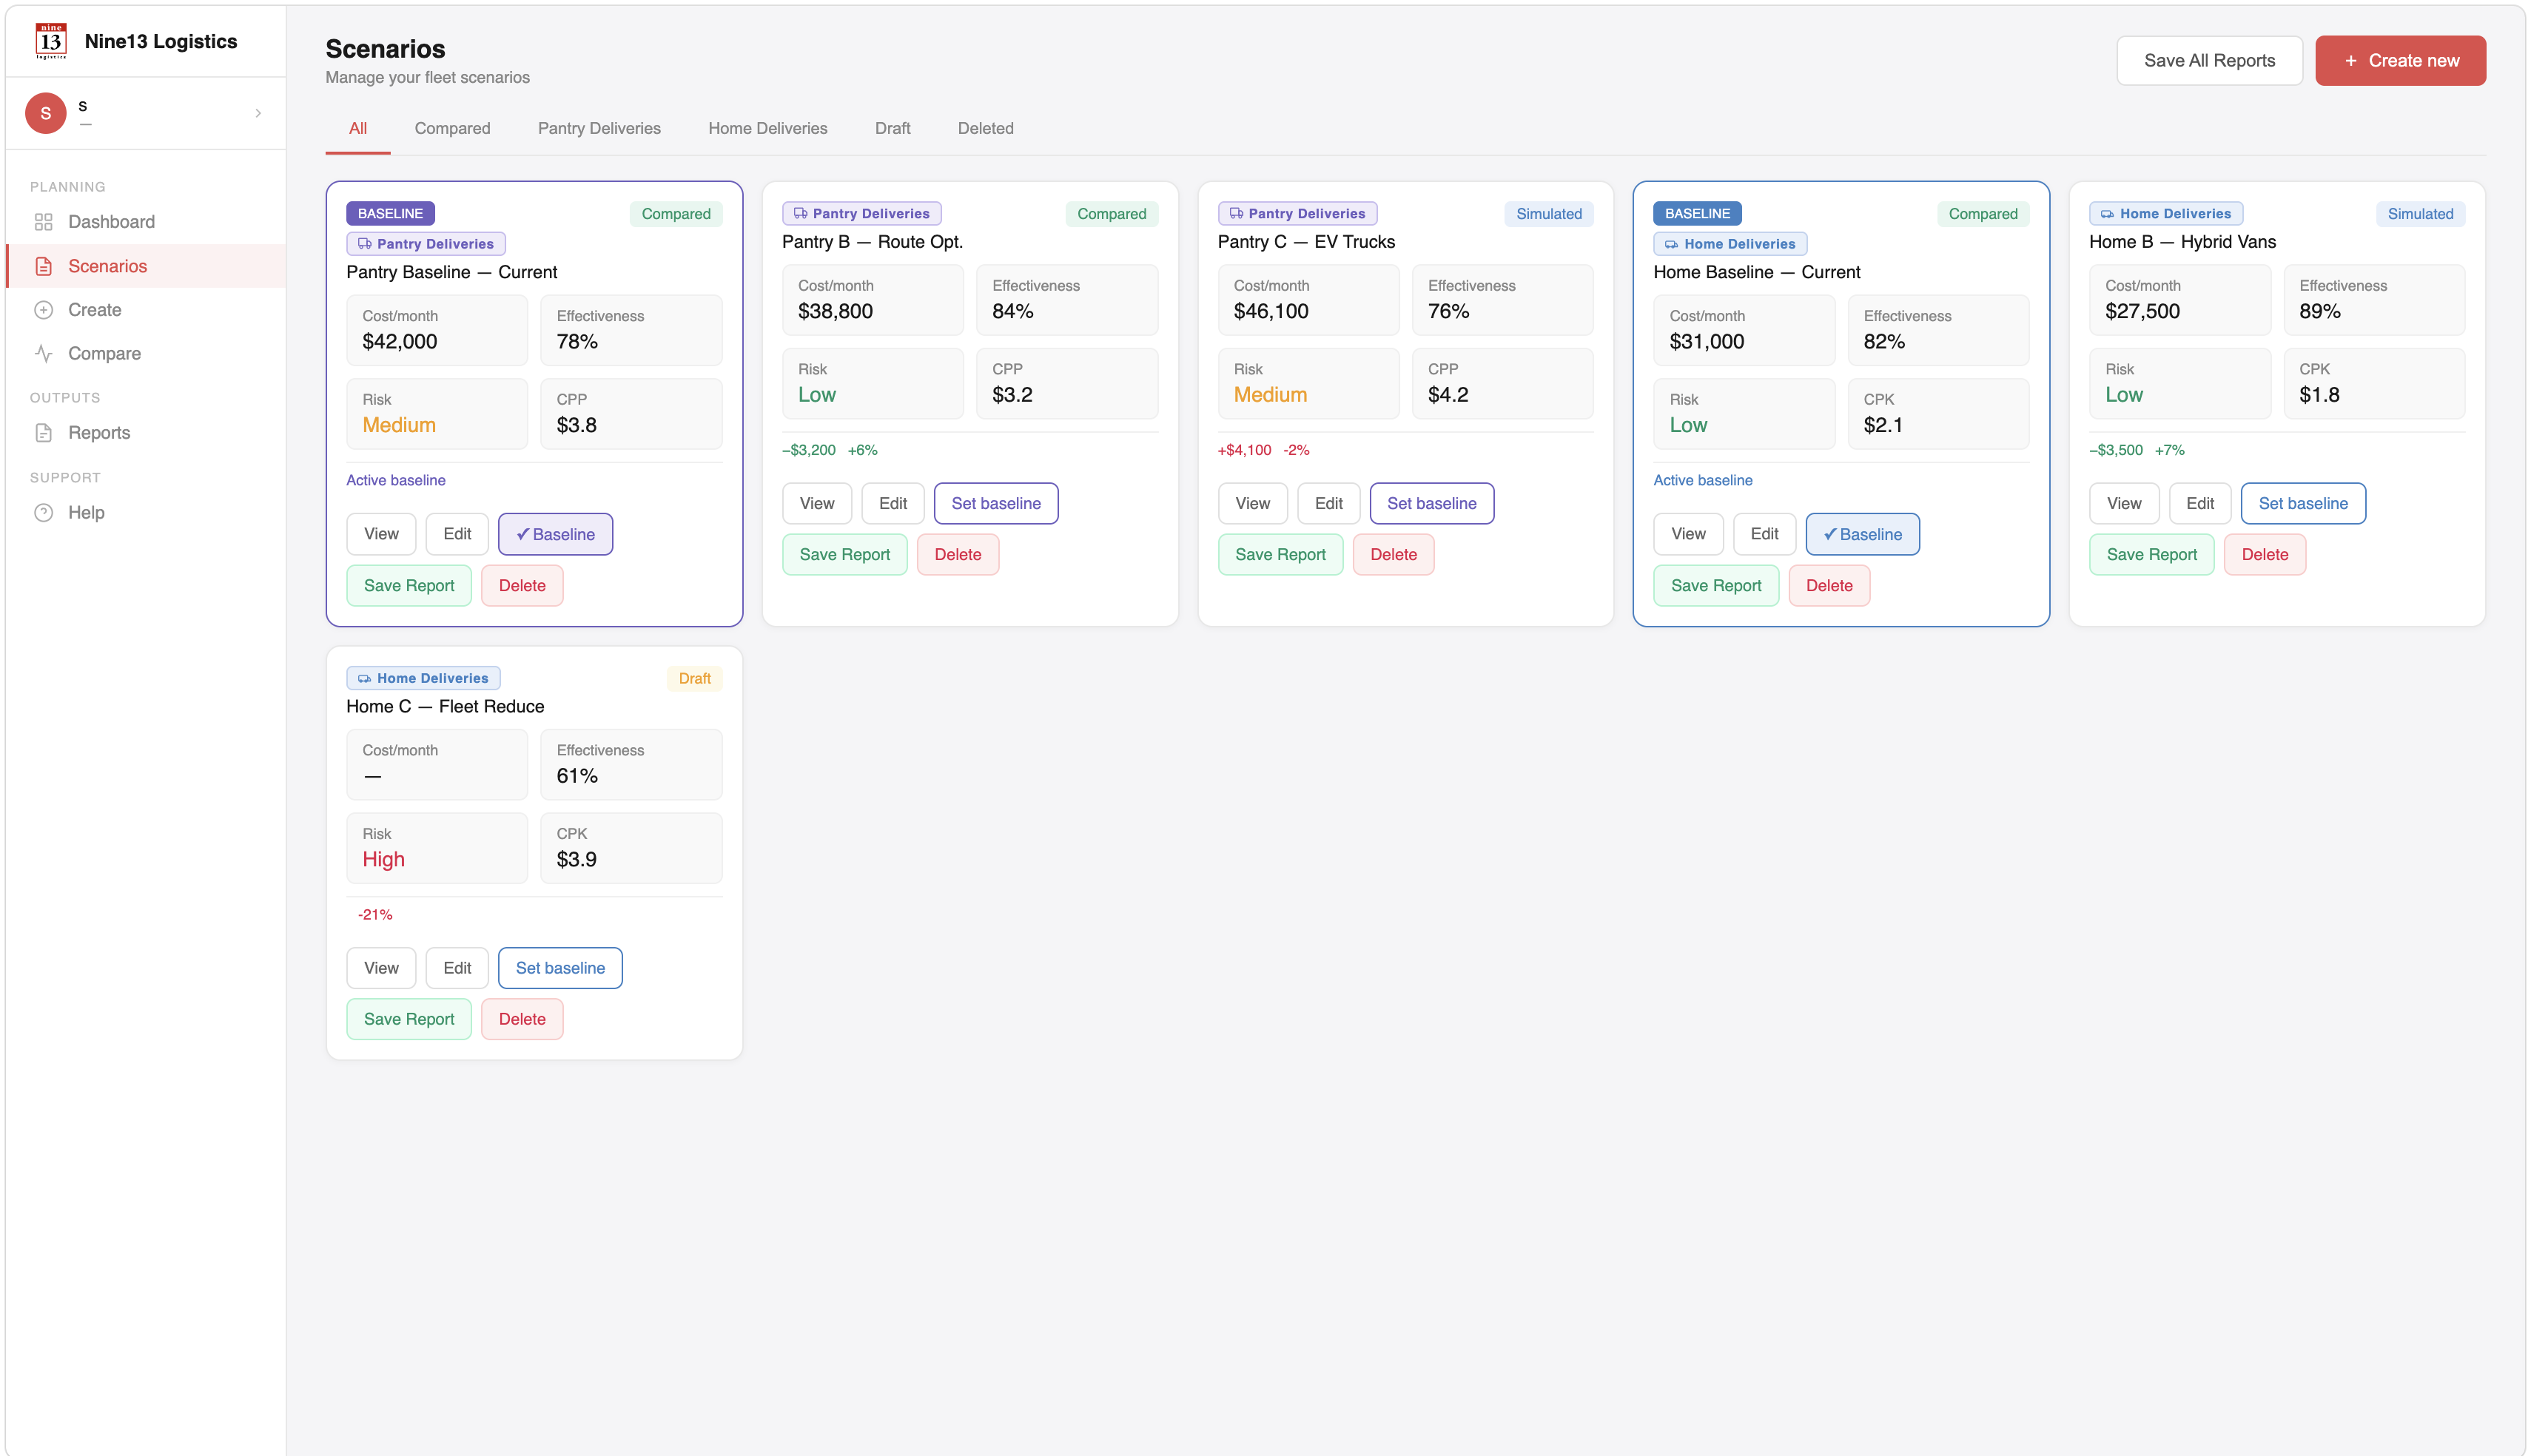
5. Saved Scenarios & Funder Reporting
A library of saved scenario snapshots and comparison results, organized by delivery line. Each one captures cost, effectiveness, and risk at the time of saving, and can be downloaded to present to donors, grant committees, or board members.
Symposium Presentation & Physical Documentation
The project culminated in a live capstone symposium presentation at Indiana University, showcasing our research synthesis, physical print documentation, and live tool demo to academic faculty, design industry guests, and community partners.
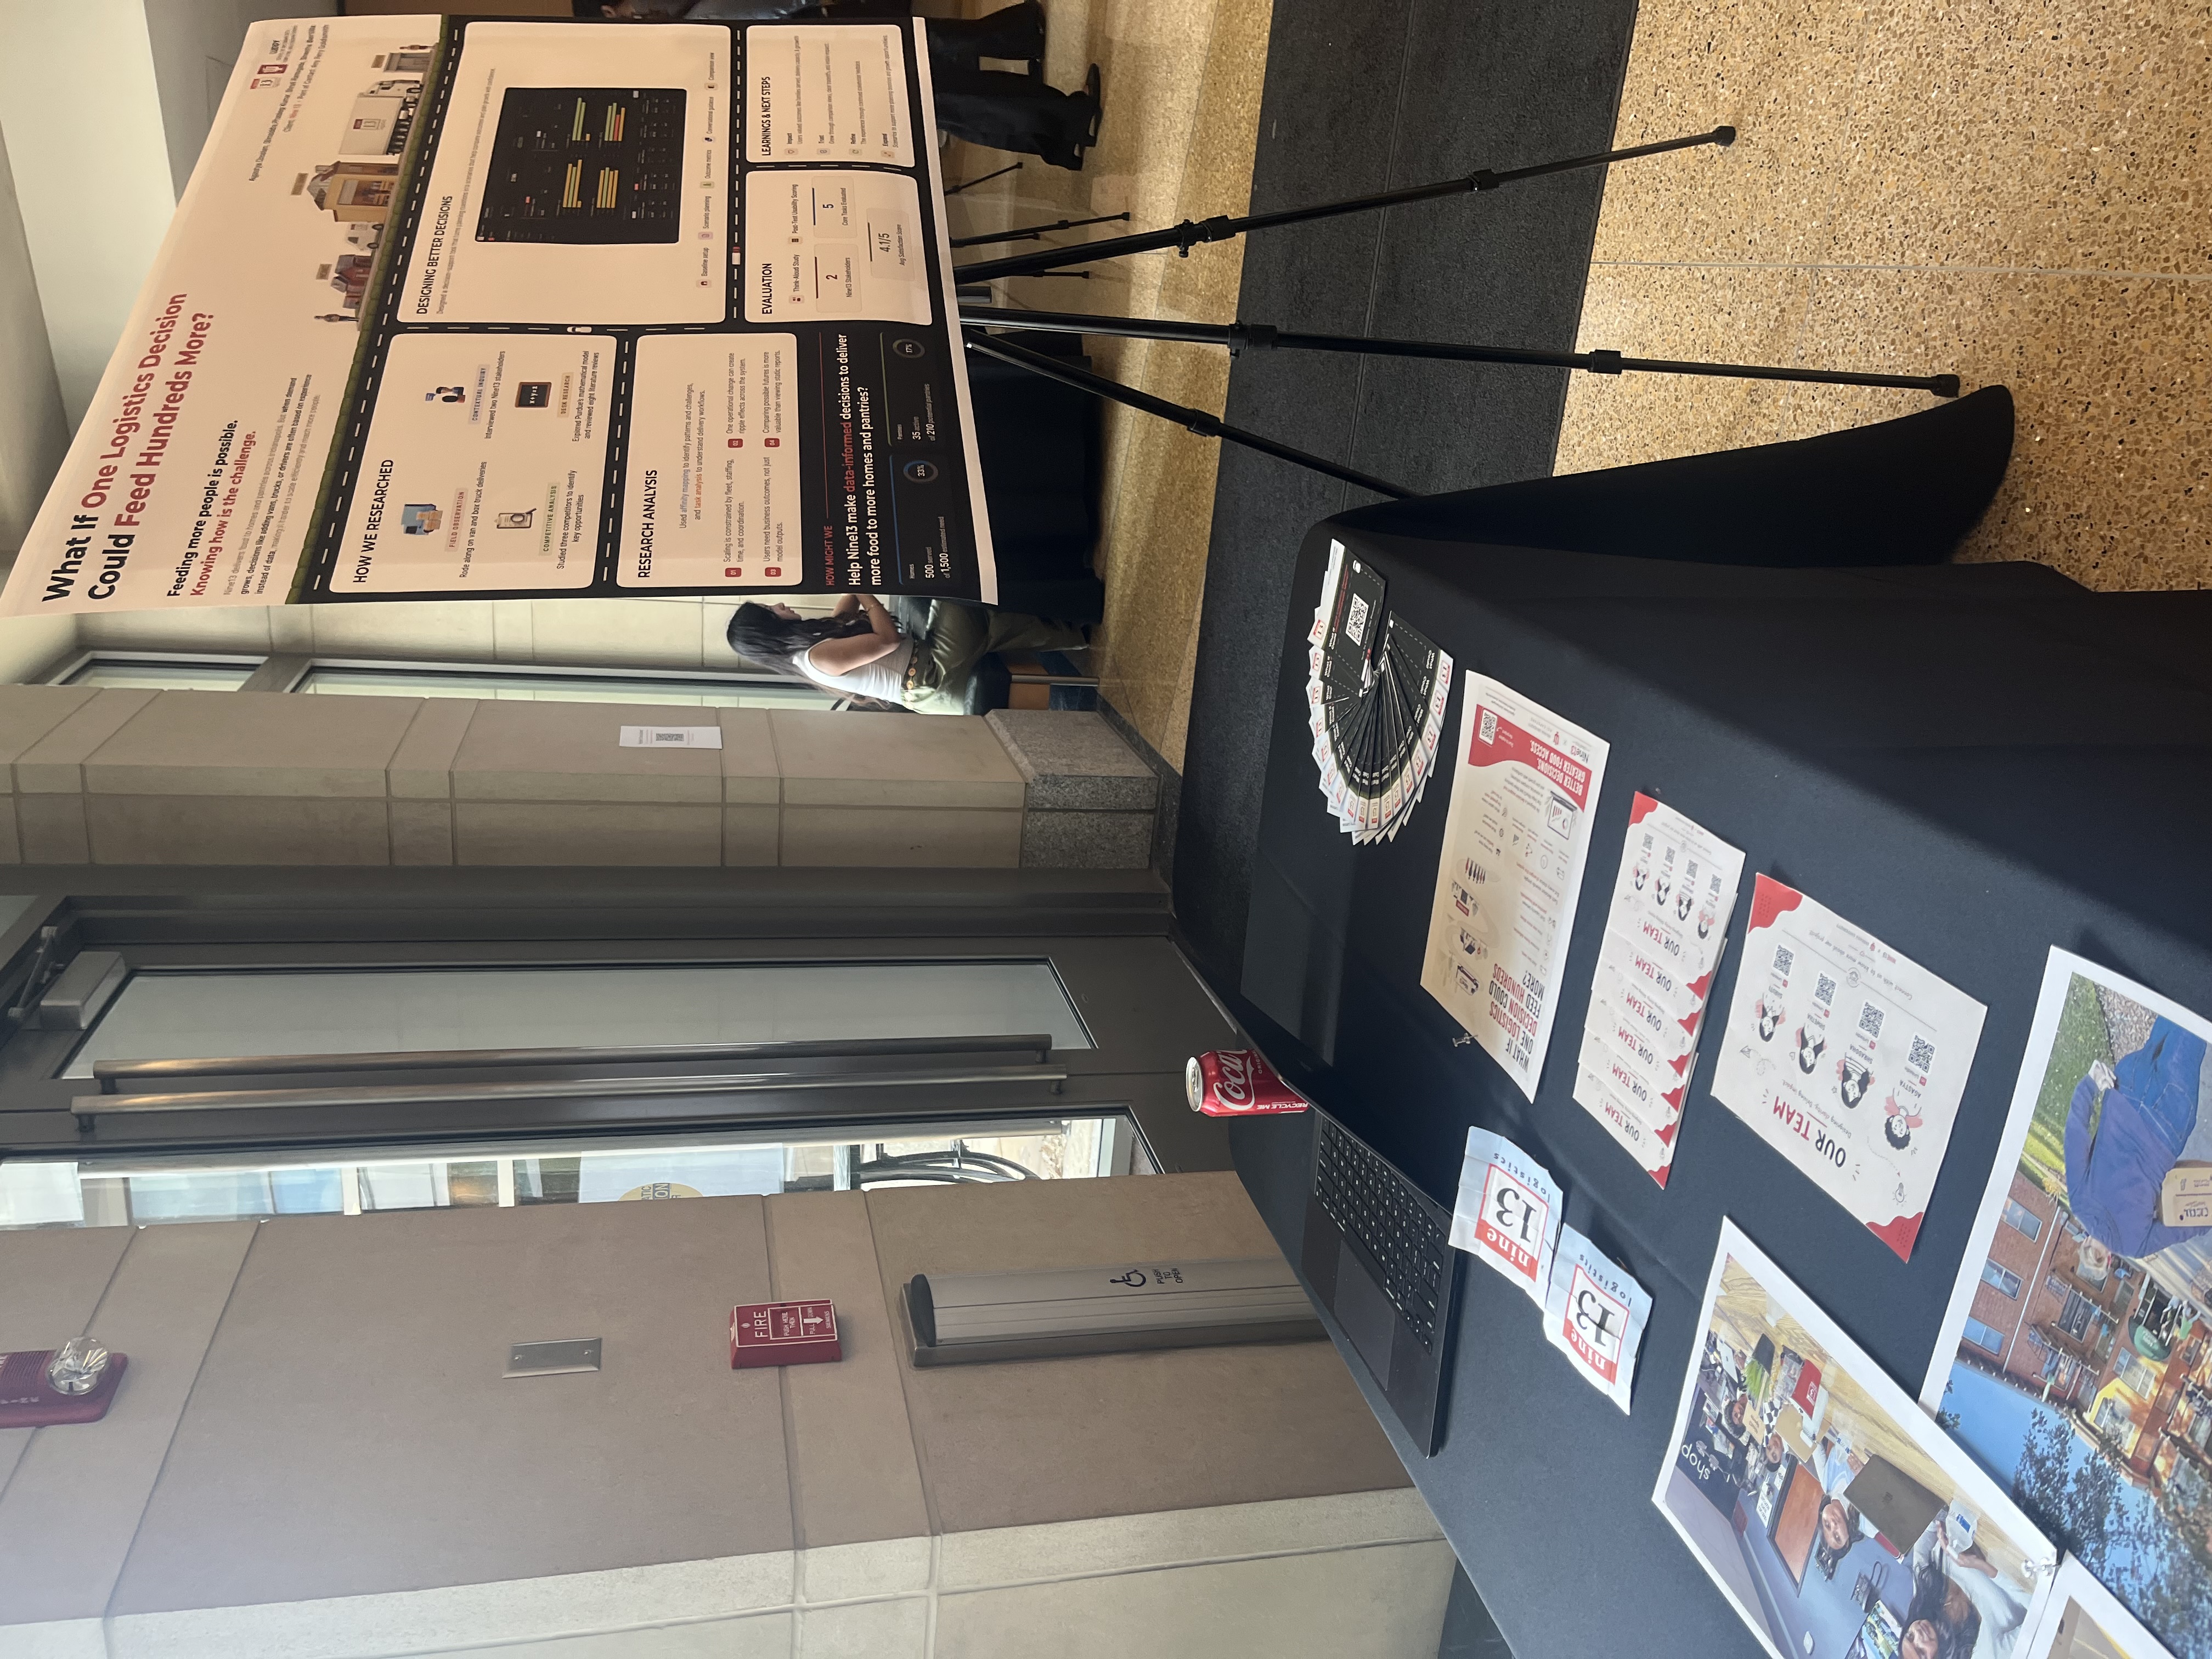
Symposium desk with live demo & reports.
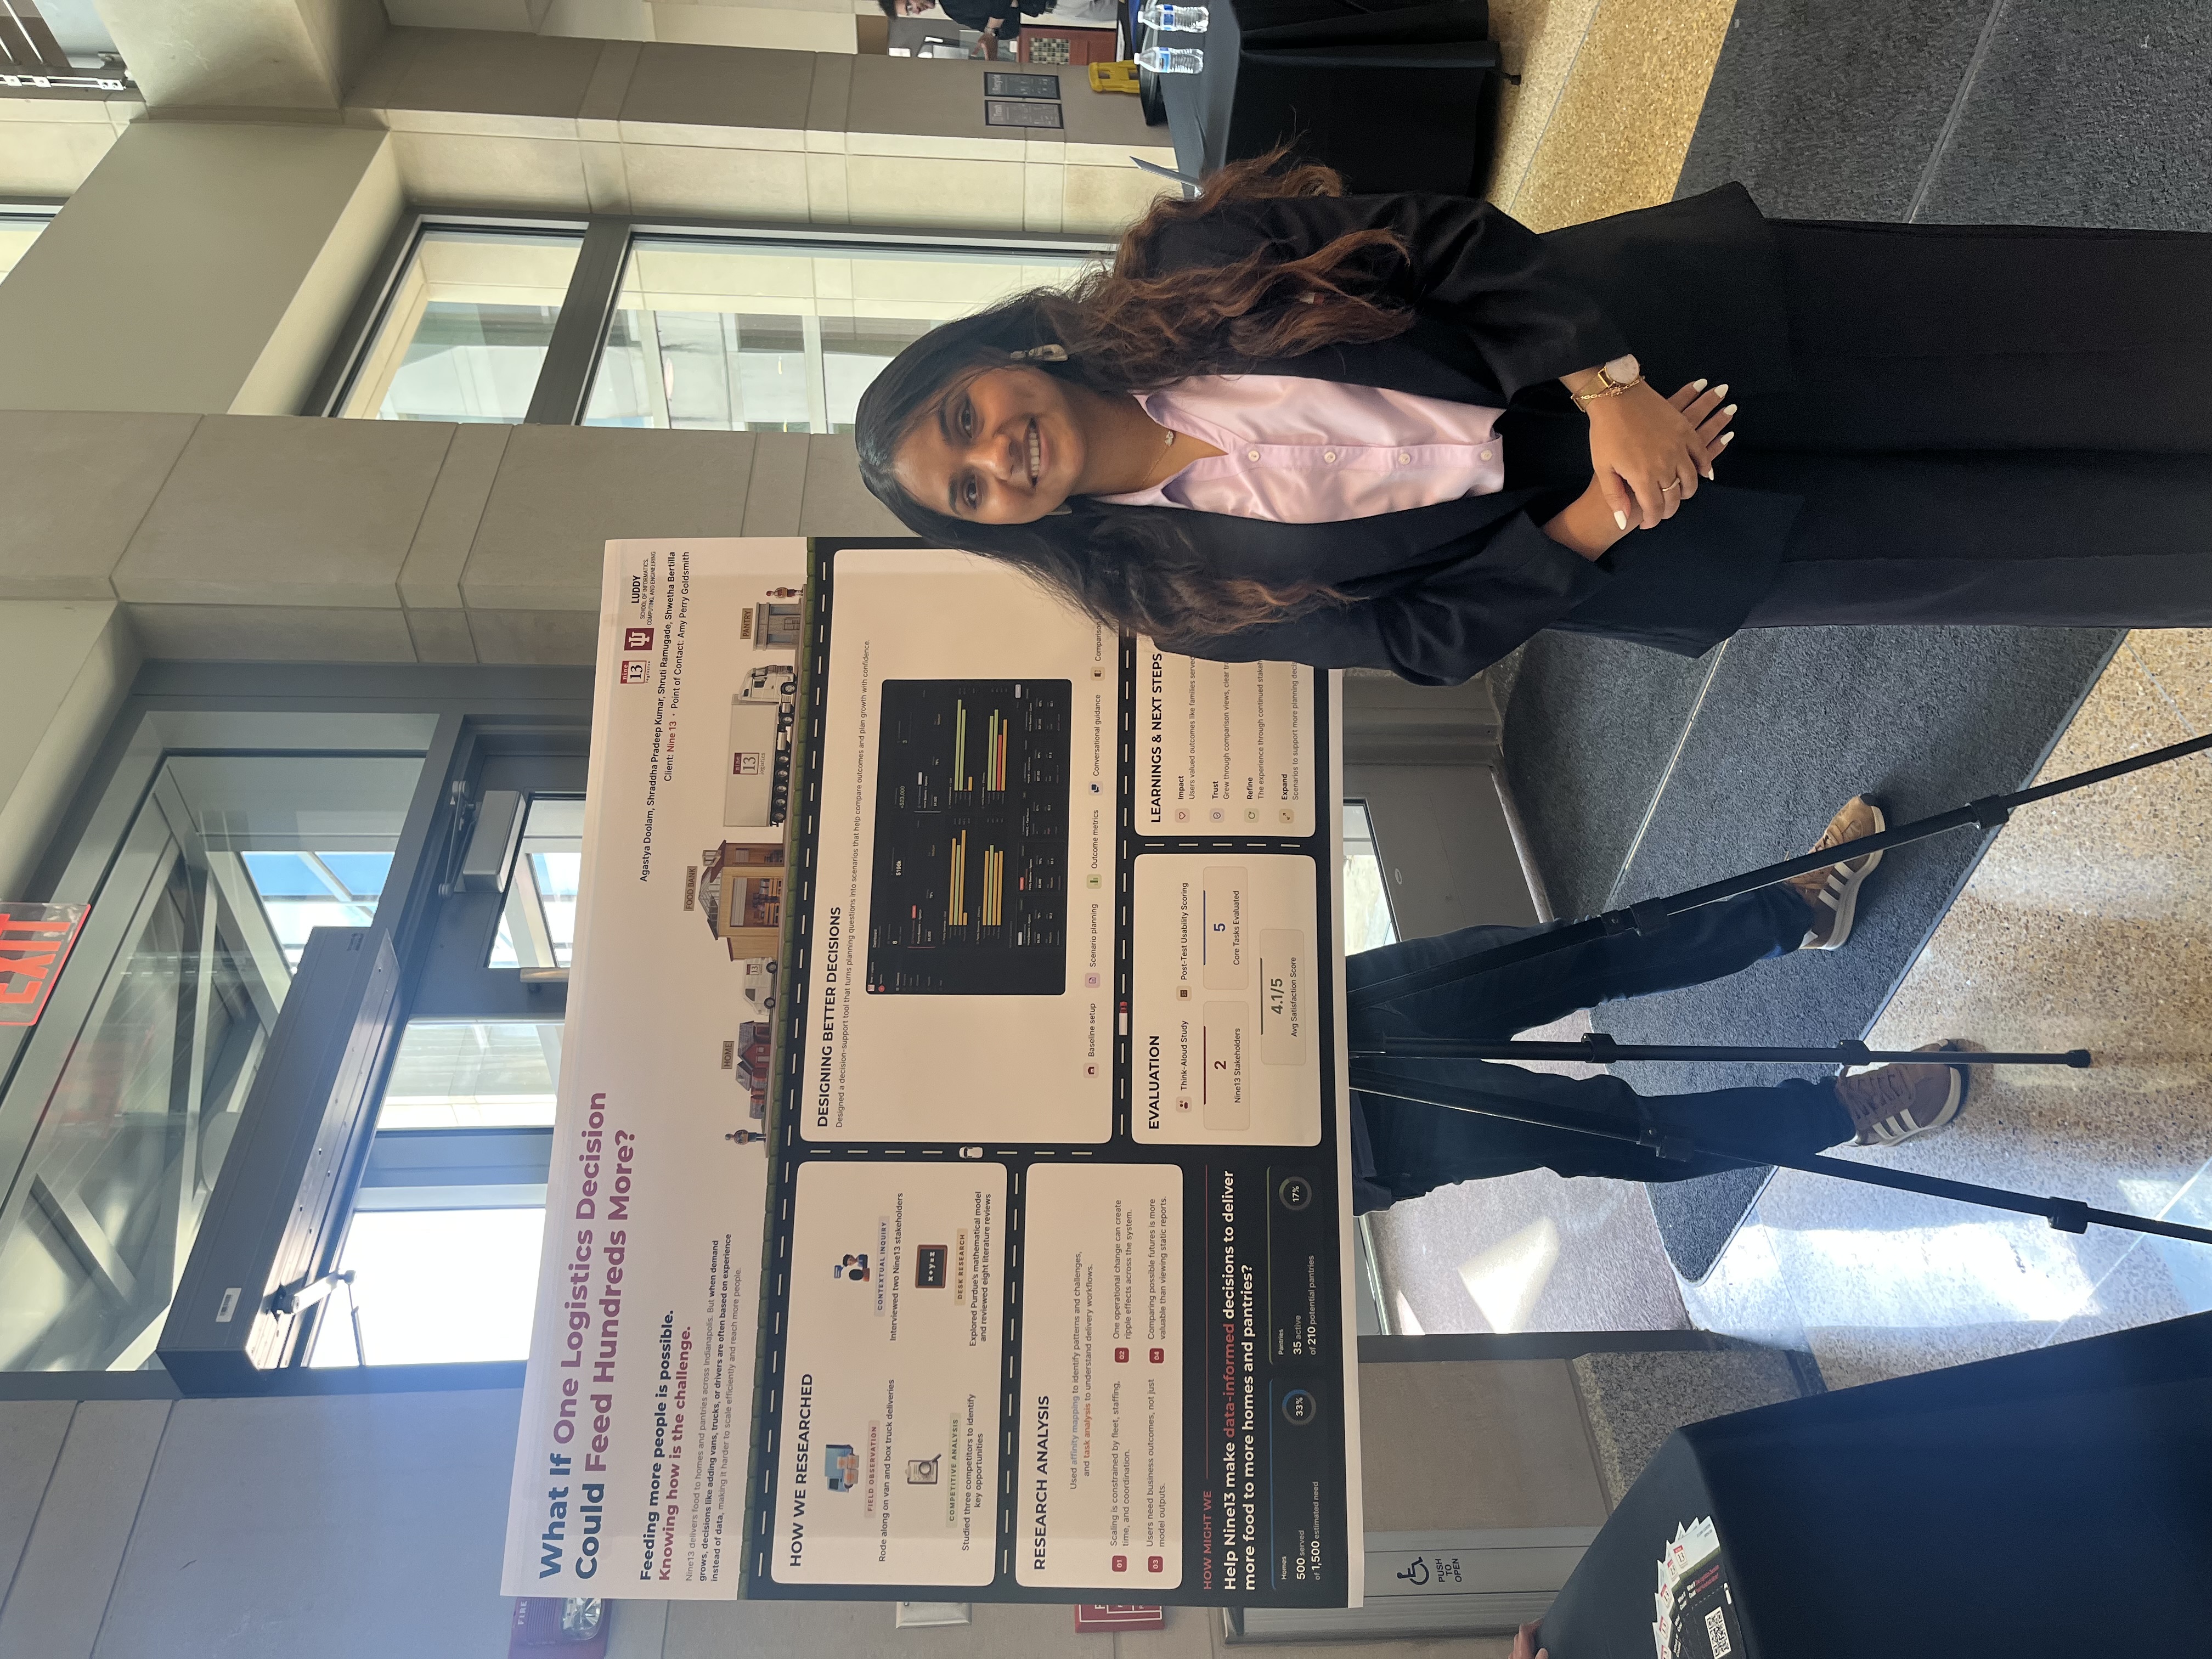
Presenting Nine13 capstone project at IU.
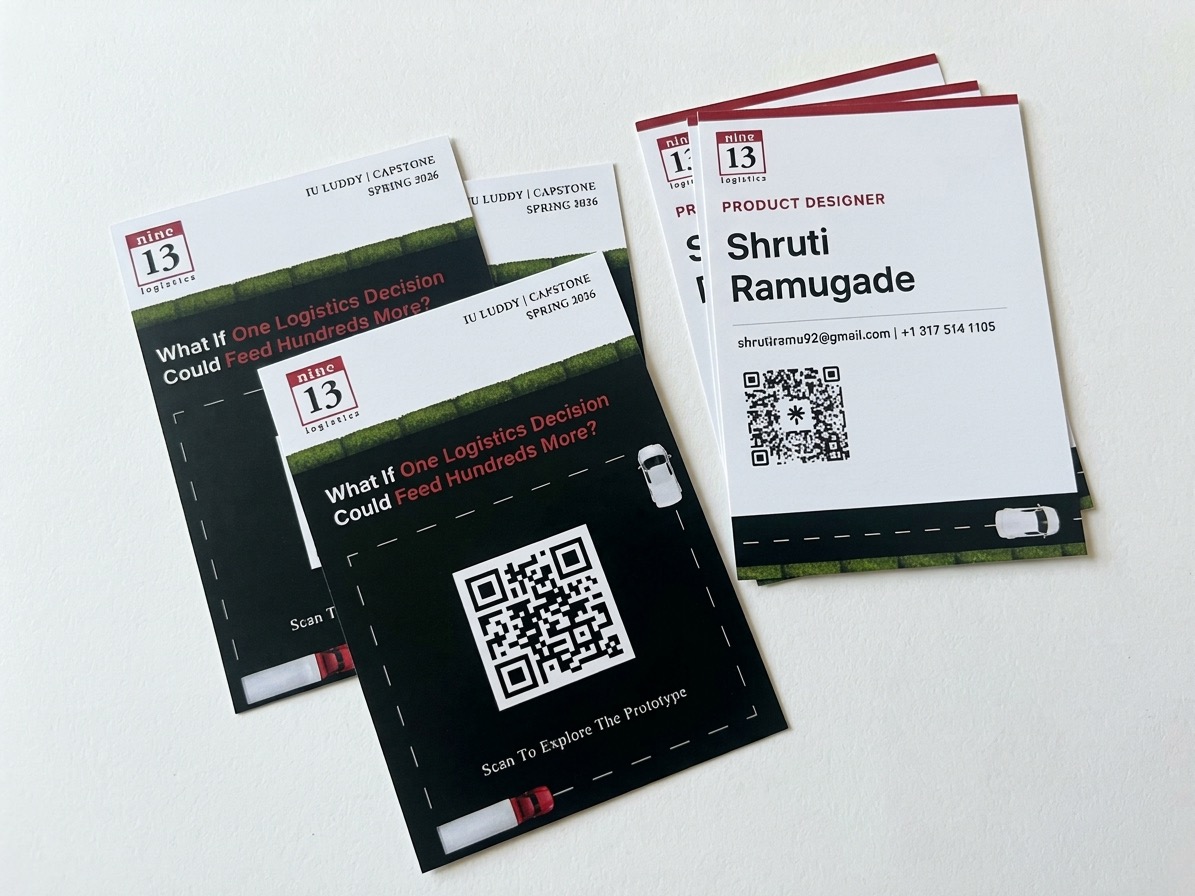
Print collateral & documentation design.
Project Reflection & Takeaways
Working directly with Nine13 and Purdue's engineering department taught me how to bridge the gap between complex algorithmic rigor and human empathy. Engineering models often assume clean data inputs; real-world logistics operate in noisy, human environments with locked doors and seniors who just want to share a story before taking their food box.
By honoring the human standard of Nine13, our design ensured technology empowered their mission rather than sanitizing it.